World Nears Dangerous Climate Tipping Point With Snow in Short Supply
Global warming is impacting winter storms and mountain snowpack around the world, leading to devastating consequences including prolonged drought.
It’s winter in the north, but you wouldn’t know it in many places: Snow is MIA, much to the chagrin of everyone from ski resort managers to schoolkids hoping for a day off. Though a punishing storm is dumping snow along the northern band of the US, events like that are proving an exception to what’s quickly becoming the new rule. Snowpack is in decline in the world’s regions most dependent on it for winter recreation, and more importantly, springtime water.
Greenhouse gas pollution is contributing to winter precipitation falling as rain — or even not at all. Northern California’s snowpack this week sat at just 38% of its average, a worrisome figure given the dependence of the state’s $56 billion agriculture industry on melted snow. The Golden State isn’t alone; Italy’s snowpack is 45% below average and parts of Afghanistan have seen record lows.
Nearly half of 169 Northern Hemisphere river basins analyzed in a high-profile study published Wednesday in Nature have seen snowpack decline since 1981. Researchers detected a climate influence in 31 of them. The US and Europe are among the hotspots for disappearing snow. The scientists behind the study formally and with virtual certainty untangled a human contribution to what researchers in recent years have increasingly referred to as “snow drought.”
Read more: What Are Snow Droughts and Is Climate Change Making Them Worse?
The findings also contain an ominous projection: As the world warms, snow-dependent places with average winter temperatures exceeding –8 degrees Celsius (17F) become much more sensitive to climate change — a kind of tipping point that portends increasing instability for these critical water sources. Four-fifths of the Northern Hemisphere’s population is living in areas that have already passed this threshold, according to the new study.
“You’re not going to see a steady decline, of having 100% snowpack, to 80% snowpack, to 70%,” said Justin Mankin, associate professor in Dartmouth College’s Department of Geography and senior author of the new study. “It’s going to be these years of, essentially, no snow.”
For millennia, people settled in the shadows of mountain ranges across the Earth’s temperate regions. Winter reliably blanketed peaks with snow, and then more snow, and then more still, until springtime warmth turned trickles into rivers that made life downhill possible. That reliance on mountain snow continues today.
“We have all sorts of crops and other uses that used to receive the bulk of water in May and June for centuries,” said Francesco Avanzi, a hydrology and snow researcher at the CIMA Research Foundation in Savona, Italy. “They are not receiving it anymore with the same consistency.”
There are droughts defined by a lack of rain and others by dry soil. There is streamflow drought and groundwater depletion. Snow drought offers a new view of the drying mountains: It’s a condition brought on by either a lack of winter precipitation or temperatures too warm for snow.
How alpine water towers collect snow is extremely sensitive to change. A 1C (2F) increase in temperature can reduce the amount of water stored in snow in early spring by 20%.
“That’s how sensitive the system is to snow — one single degree of temperature change,” said Amir AghaKouchak, professor of civil and environmental engineering at the University of California at Irvine. “The implications are huge, both for ecosystems that don’t get a lot of attention and also drinking water.”
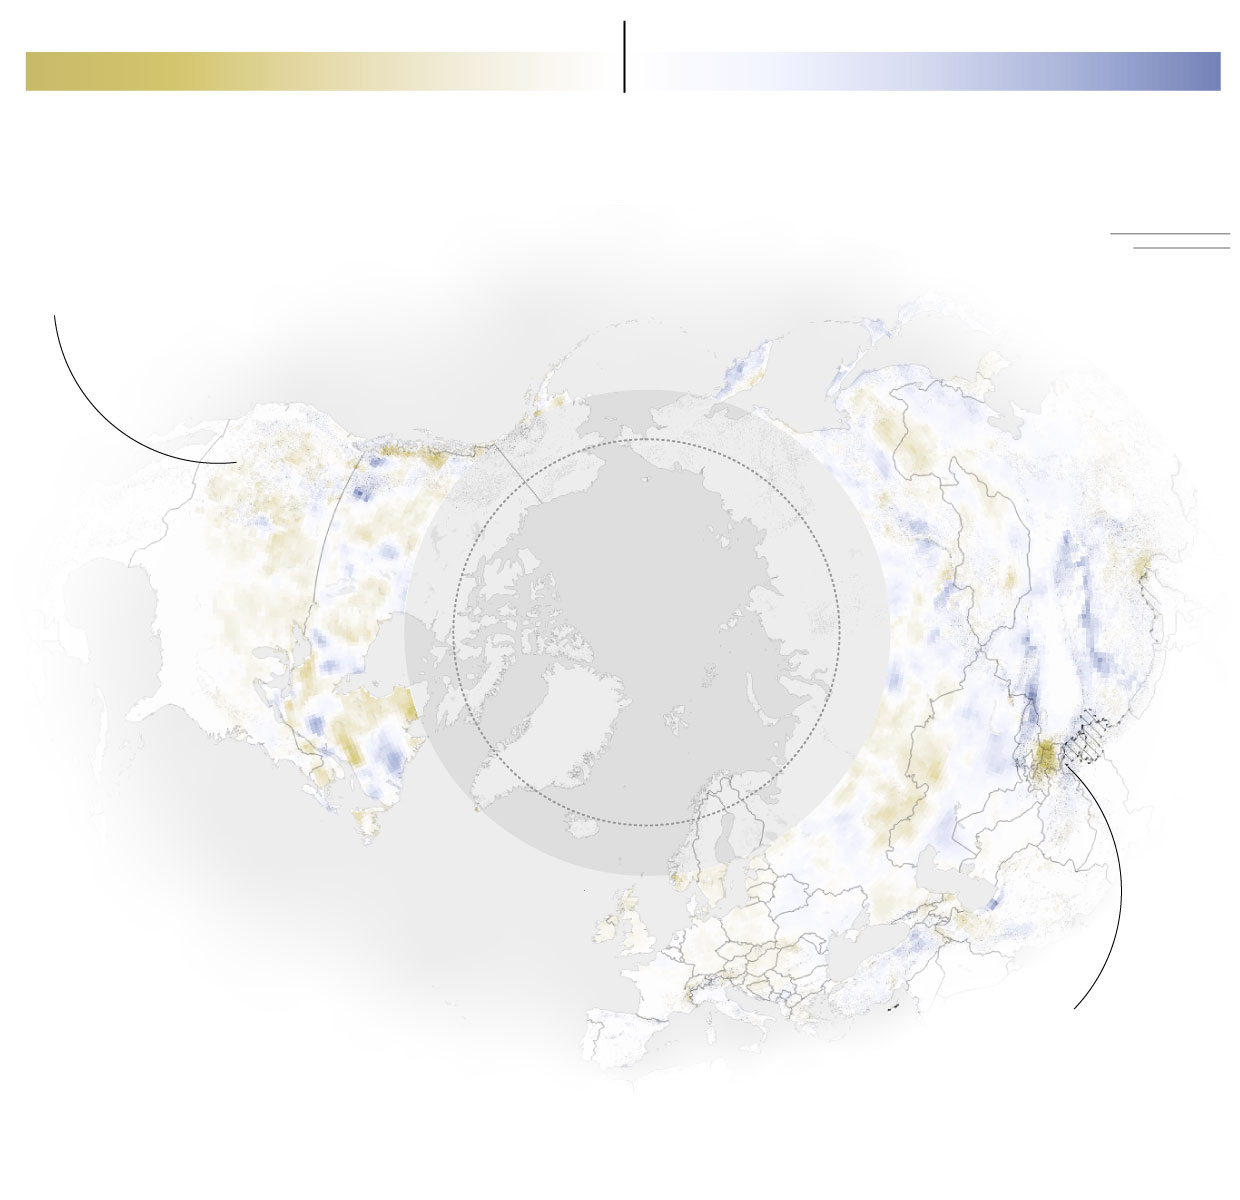
AghaKouchak and Laurie Huning, an assistant professor of civil engineering at California State University, Long Beach, published the first global analysis of snow drought in 2020. They found that several mountain regions saw an uptick in snow drought intensity, length and frequency in the first 18 years of this century compared to the 19 years preceding it. The mountains of the western US, Europe and eastern Russia were among the most impacted.
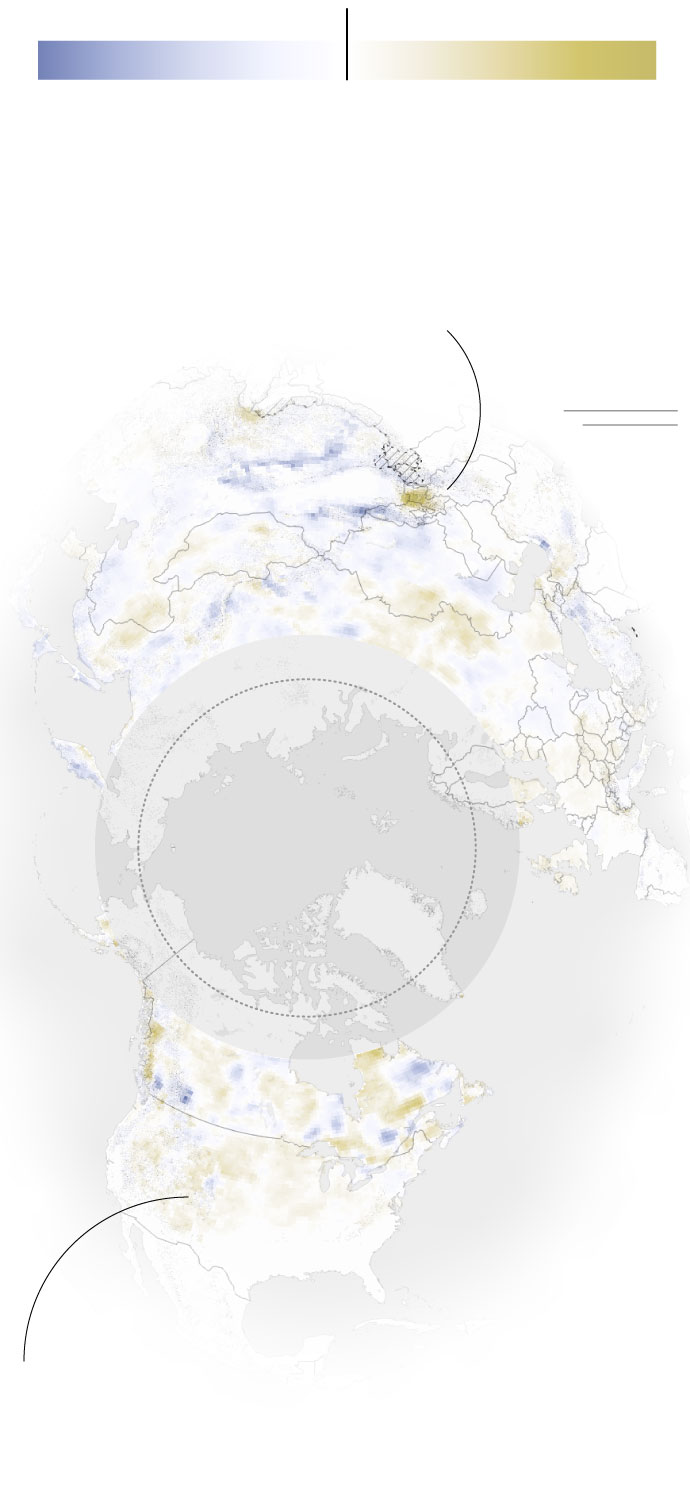
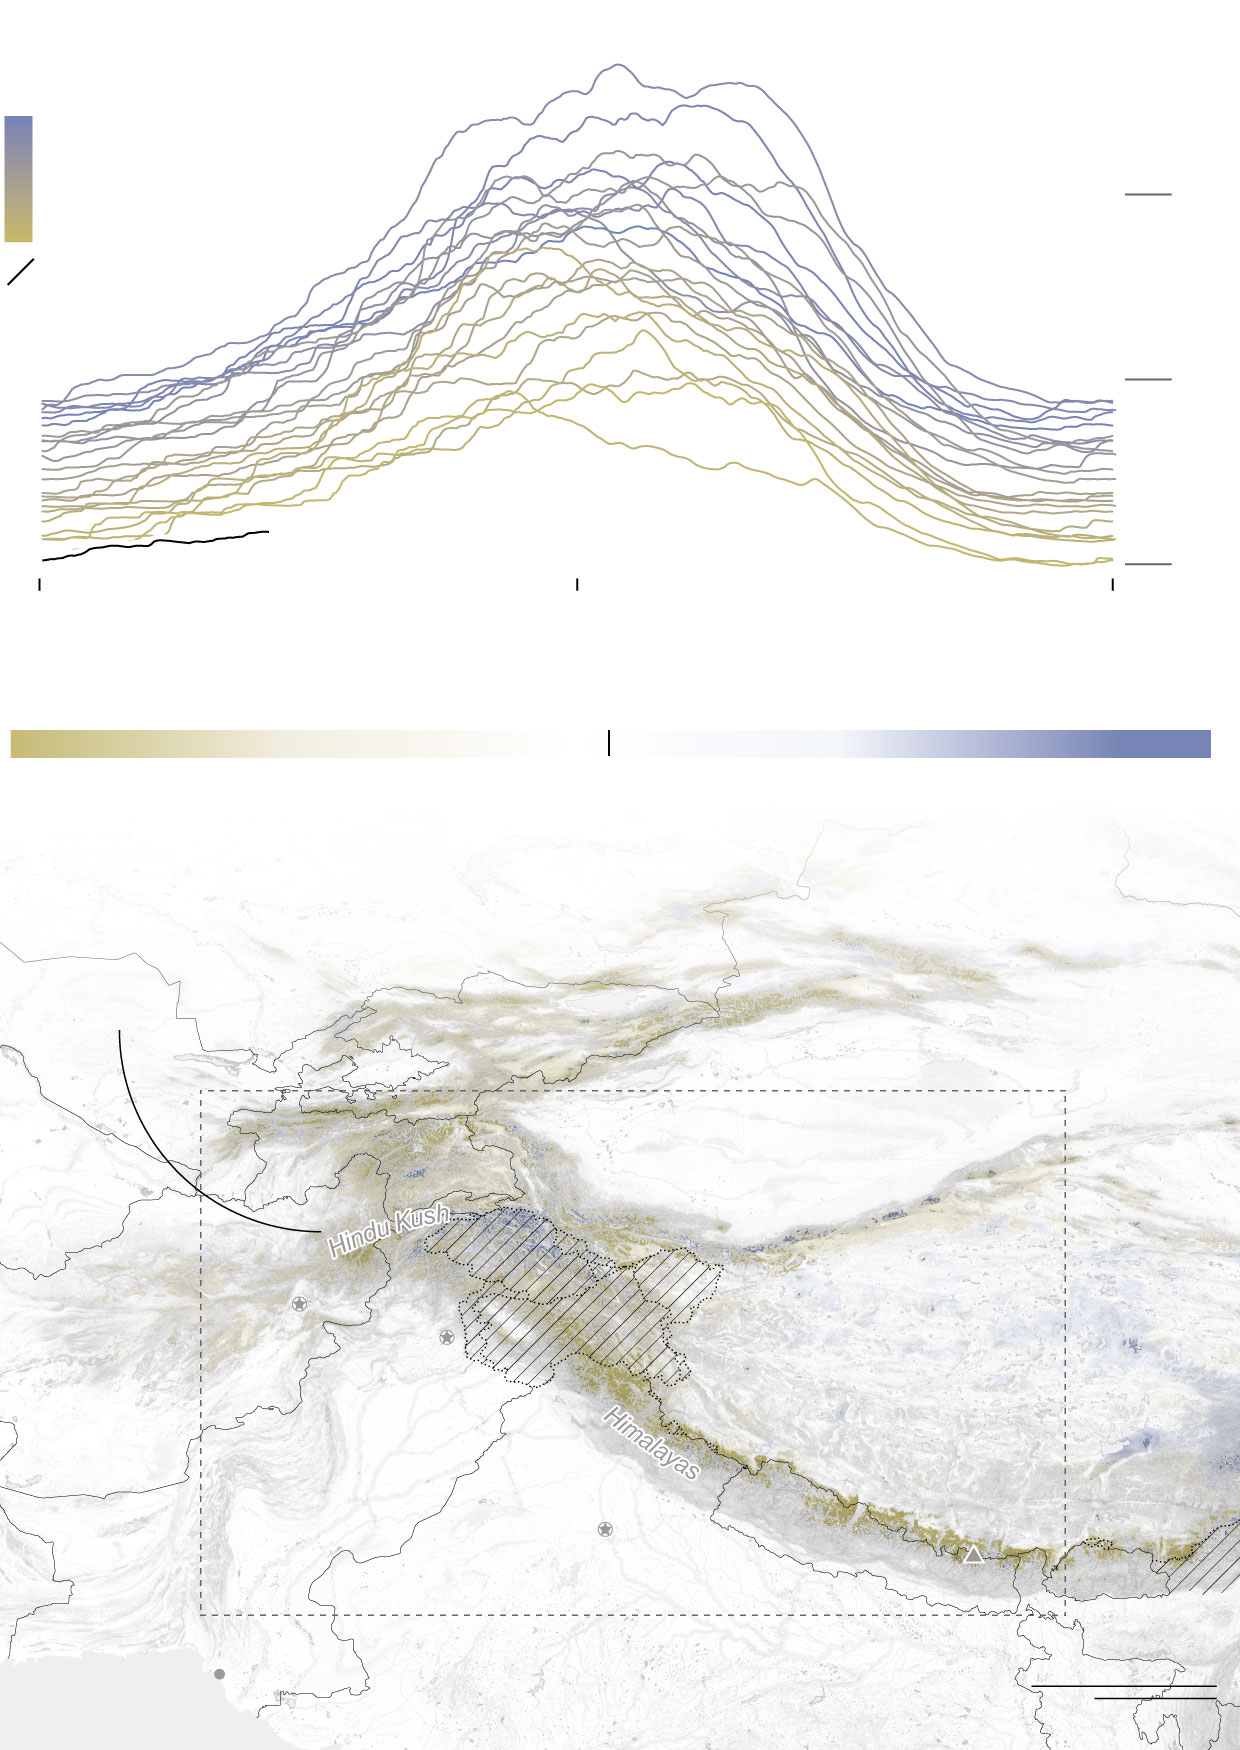
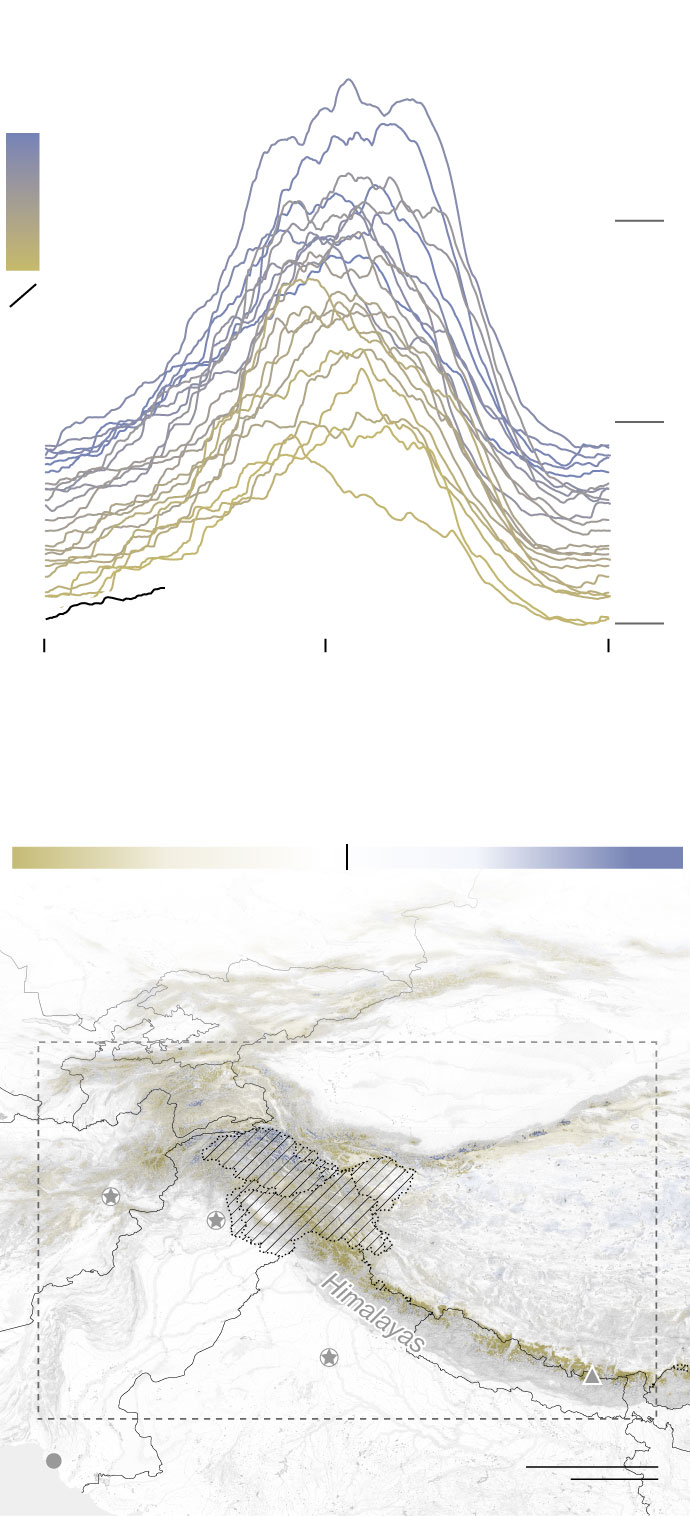
Snow Drought Hot Spots
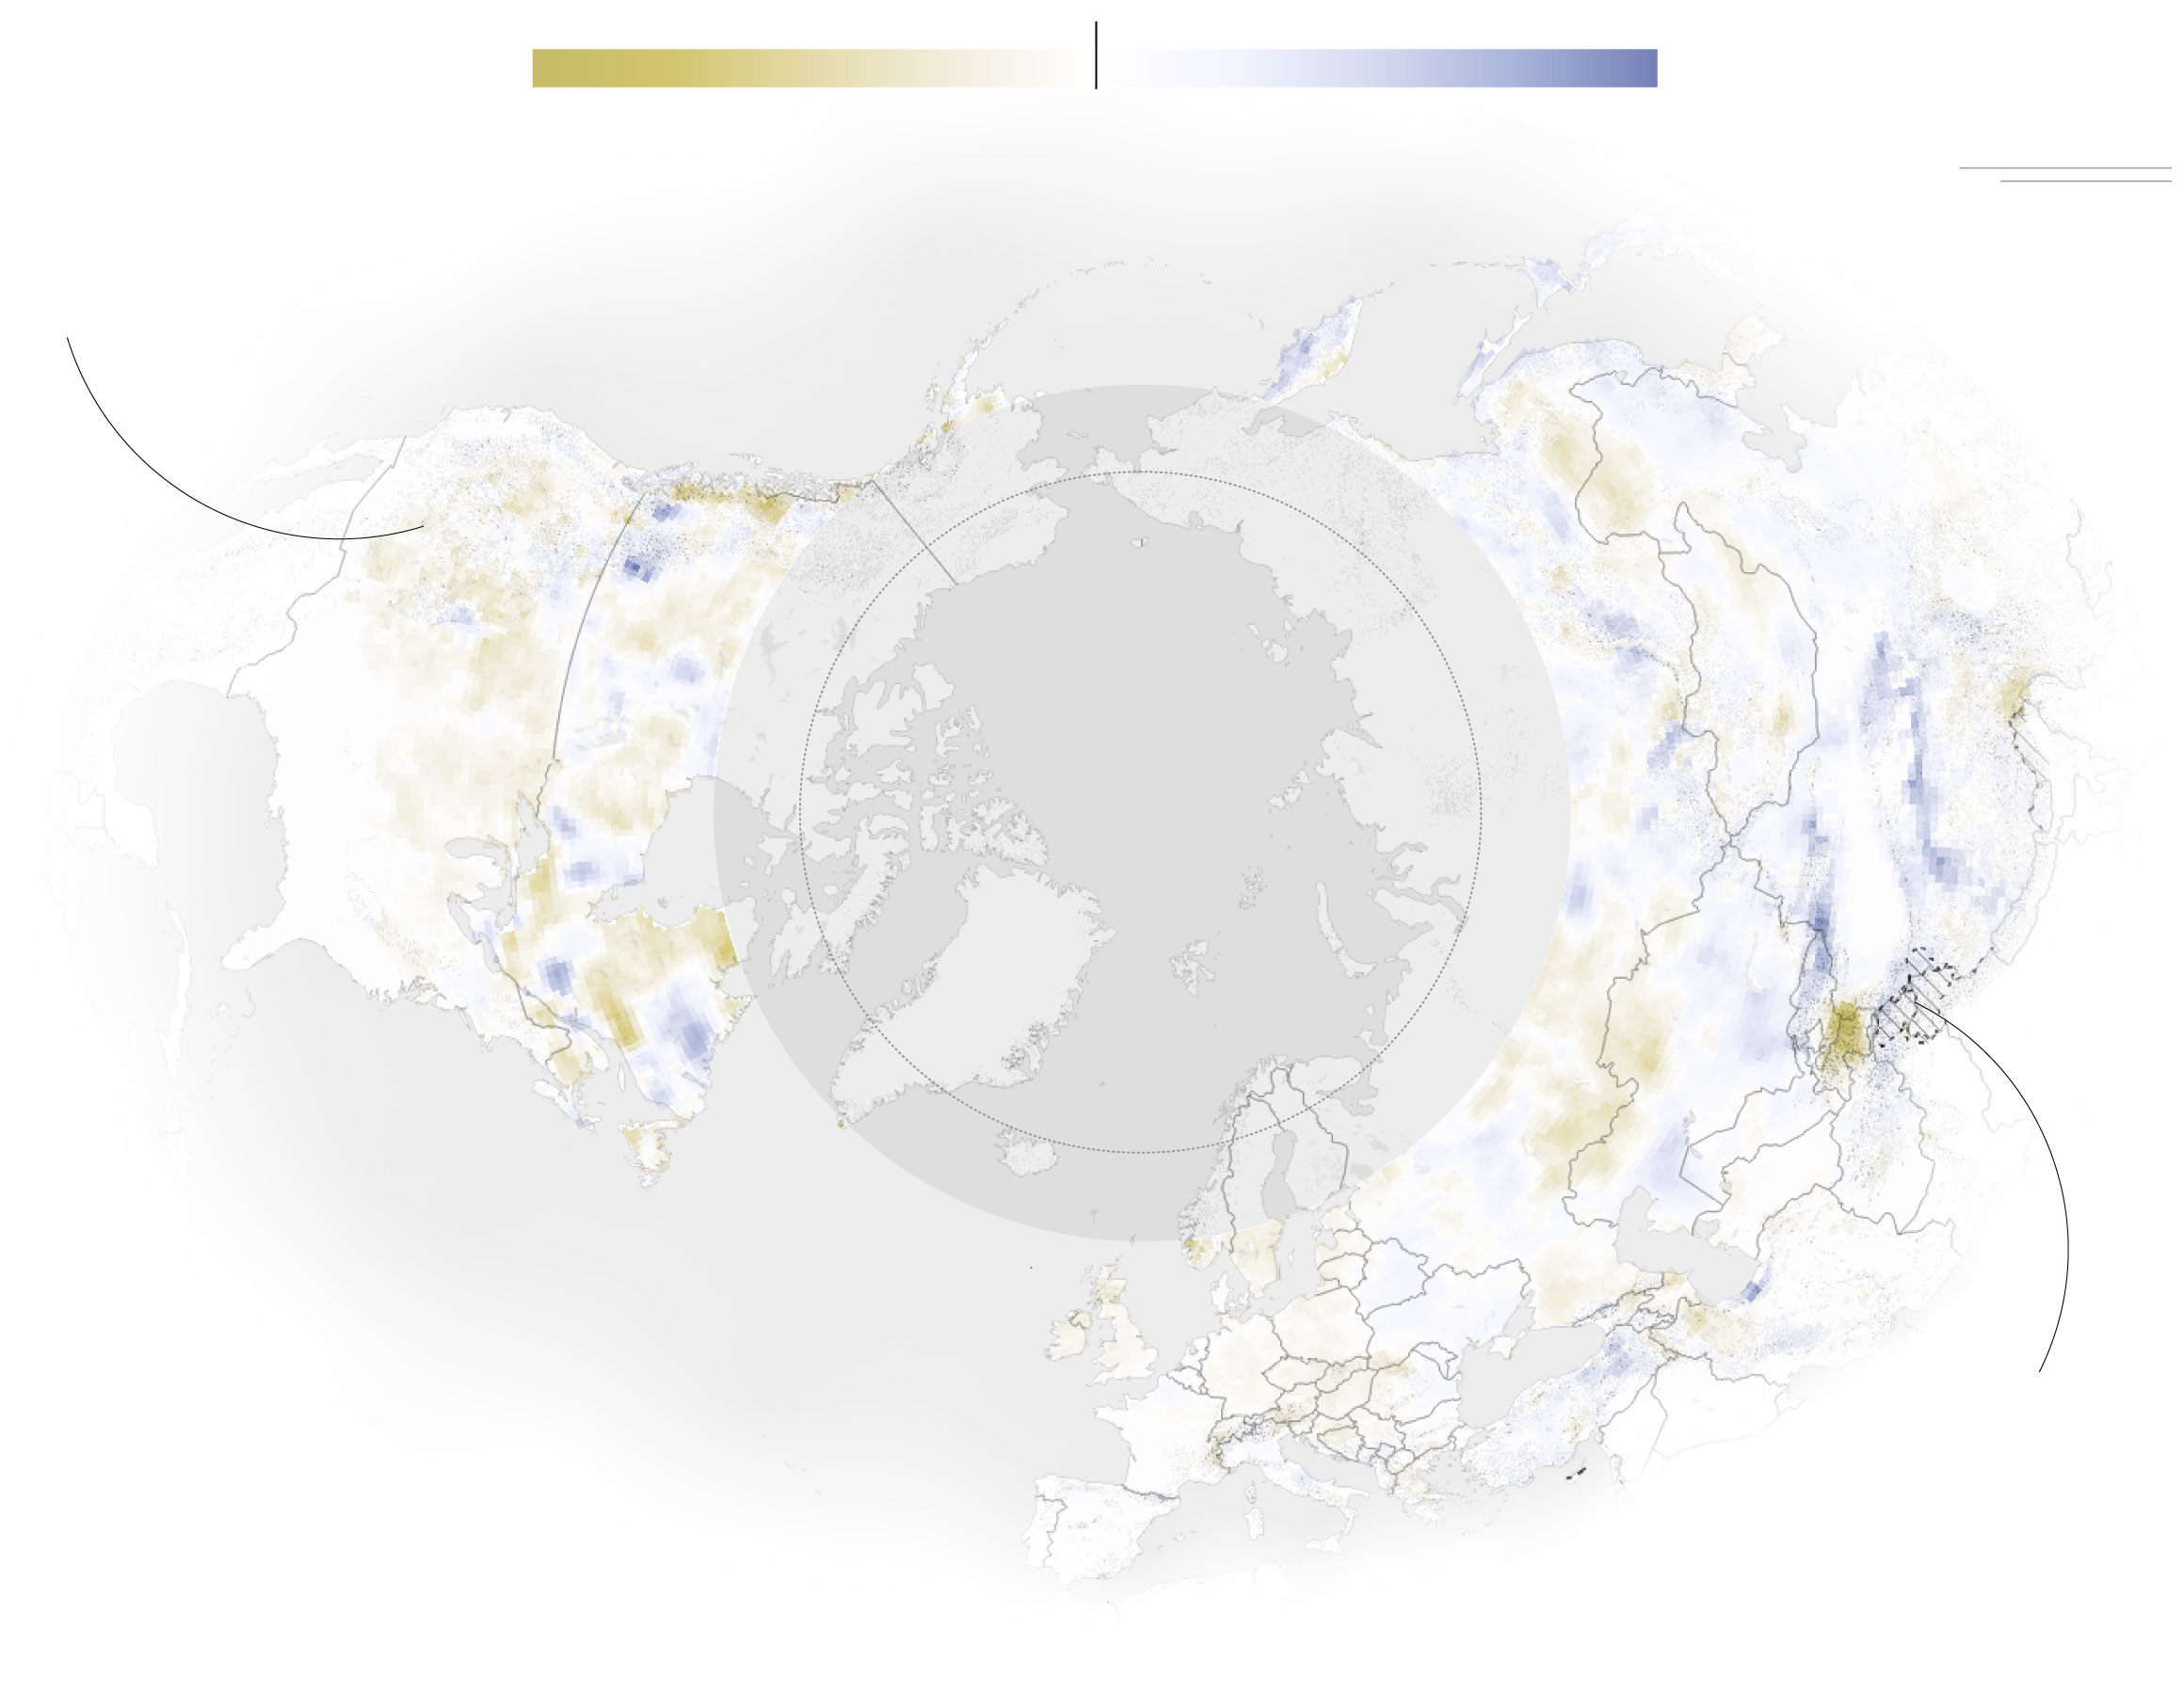
Snow drought in the US West is getting worse since the 2000s compared to the ’80s and ’90s.
US
Arctic Circle
RUSSIA
CHINA
EUROPE
Central Asia including the greater Himalaya and Hindu Kush regions saw decreases in average snow drought duration
Snow drought in the US West is getting worse since the 2000s compared to the ’80s and ’90s.
US
Arctic Circle
CHINA
RUSSIA
EUROPE
Central Asia including the greater Himalaya and Hindu Kush regions saw decreases in average snow drought duration
Central Asia including the greater Himalaya region and Hindu Kush saw decreases in average snow drought duration
CHINA
RUSSIA
EUROPE
Arctic Circle
Atlantic
Ocean
Pacific
Ocean
US
Snow drought in the US West is getting worse since the 2000s compared to the ’80s and ’90s.
Predicting how much snow is on the ground is a challenging task historically. There’s wild variability to contend with. That’s especially true in California, where snow depth can range from a cliff with barely a speck of white stuff on it to a depression buried under about 82 feet (25 meters) — within 20 feet of each other.
Estimating how much will accumulate in a season is daunting, and even without the climate changing. It requires sophisticated modeling fed by on-the-ground and satellite measurements.
“Snow is just hard to measure,” Mankin said. That makes water researchers eager to know “what it is that we can responsibly claim about snow droughts, and what that might mean, as the world warms?”
The new work, by Mankin and Dartmouth PhD candidate Alex Gottlieb, brings more specificity to the answer. More than 2 billion people are dependent on mountain snow going through accelerating change. That’s a conservative estimate, Mankin said, because data on the Southern Hemisphere is insufficient to study.
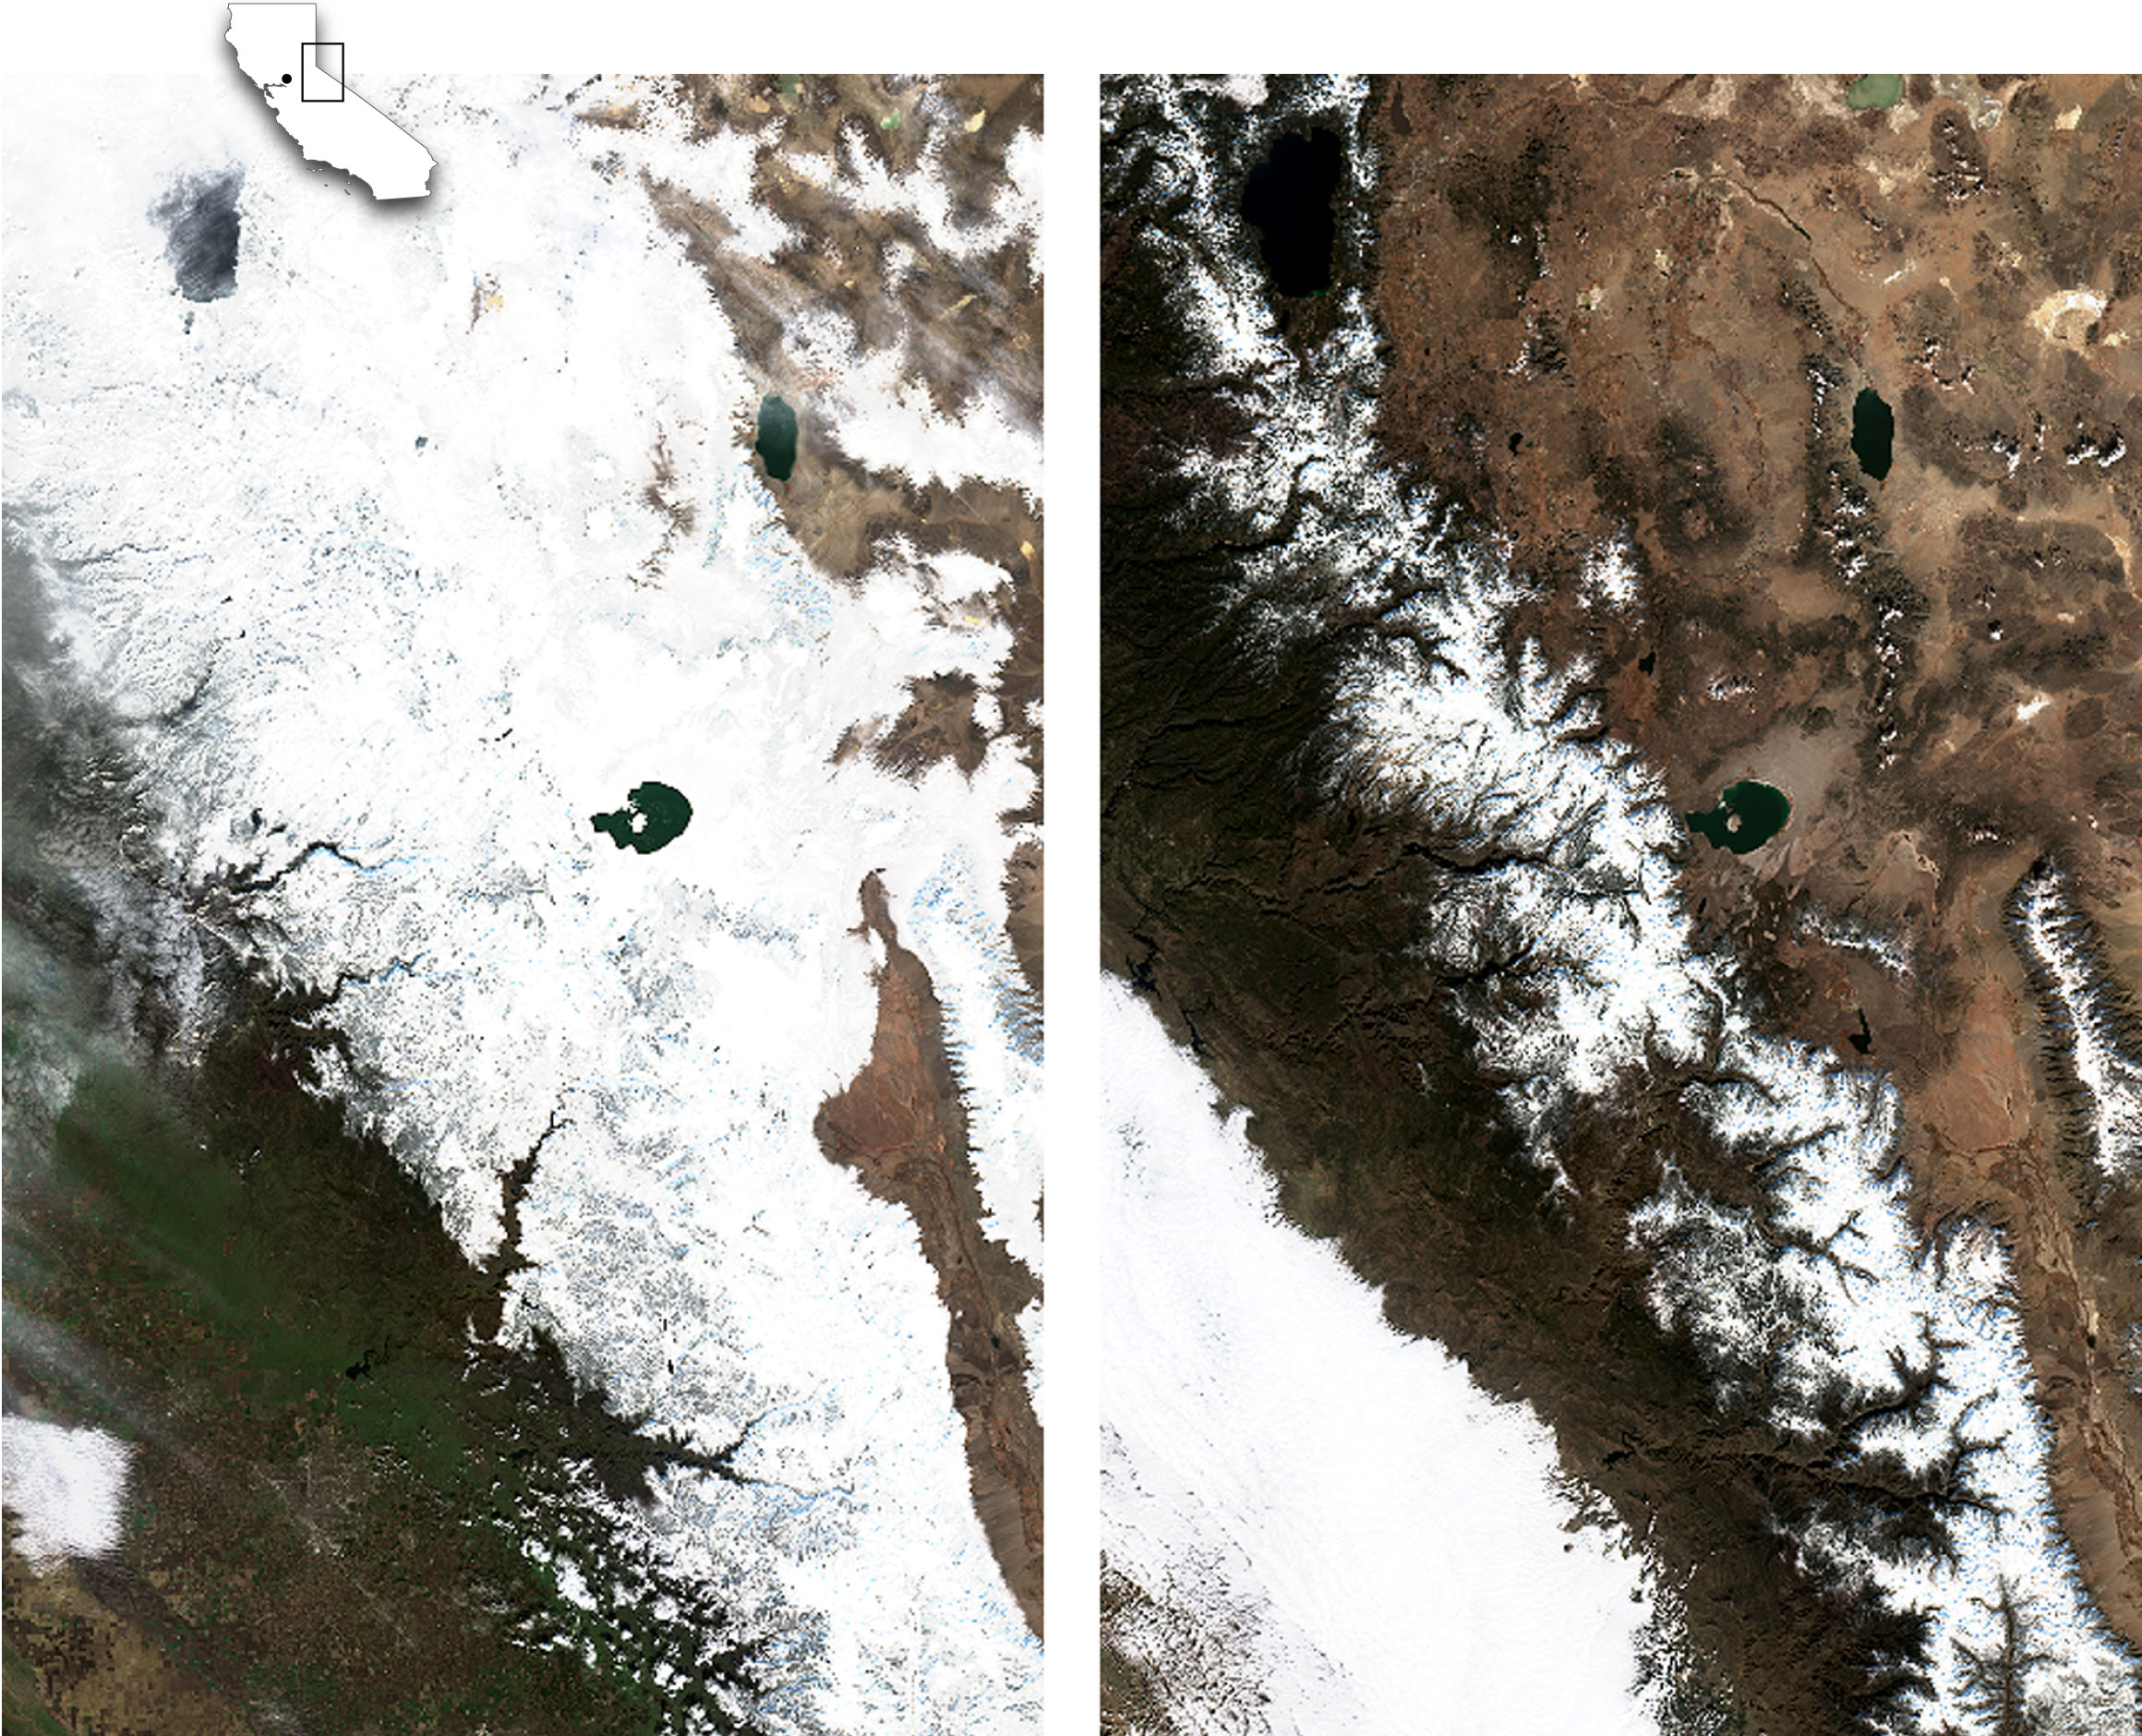
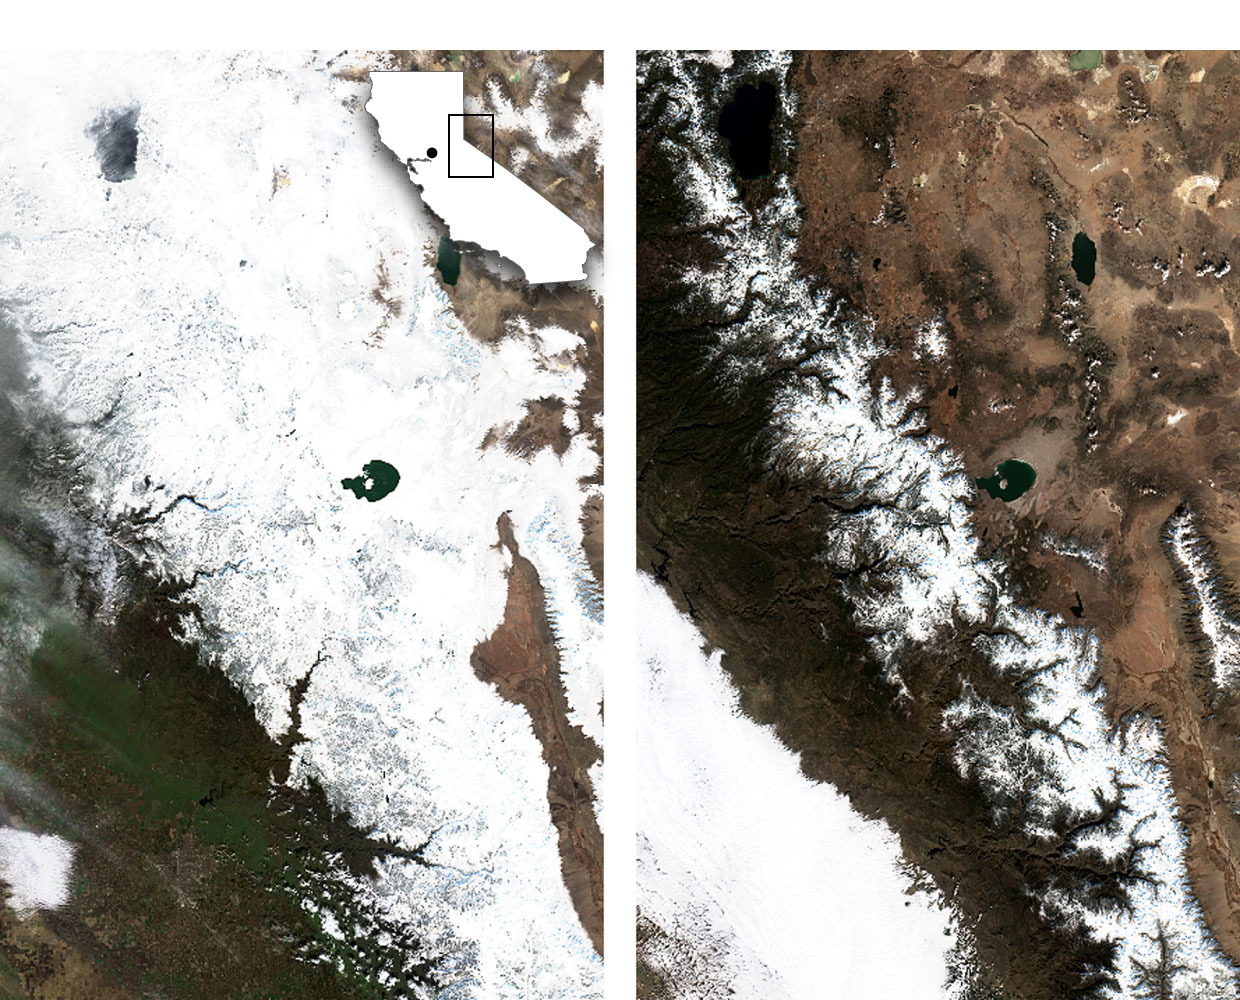
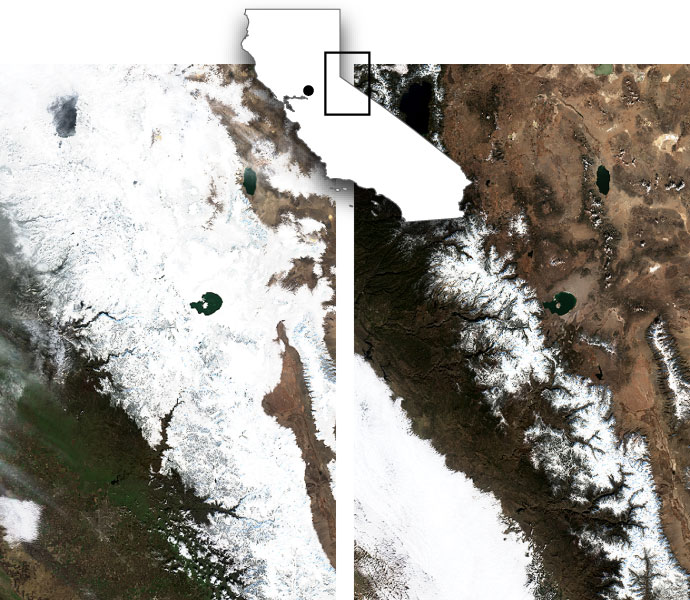
Jan. 6 2023
Jan. 1 2024
Sacramento
CA
Lake Tahoe
Lake Tahoe
Mount Patterson
Mount Patterson
Sierra Nevada
Sierra Nevada
Yosemite
National Park
Yosemite
National Park
Jan. 6 2023
Jan. 1 2024
Sacramento
CA
Jan. 6 2023
Jan. 1 2024
Sacramento
CA
Satellites have been a game changer for spotting snow drought. That’s because snow is the brightest land feature.
As a result, even the earliest satellites launched in the 1960s could detect it. Several satellites today — notably, NASA’s Moderate Resolution Imaging Spectroradiometer (MODIS) — regularly survey the world’s snow-capped peaks.
“The access to satellite data is a revolution,” said Rodica Nitu, project manager of the World Meteorological Organization’s Global Cryosphere Watch.
Satellites informed scientists that Afghanistan has 20 fewer days of snow coverage than it did a quarter century ago, according to Abror Gafurov, a hydrologist at the GFZ German Research Centre for Geosciences, who specializes in Afghanistan and Central Asia water issues. The satellite coverage helps people estimate the water stored in the mountains and therefore what to plant.
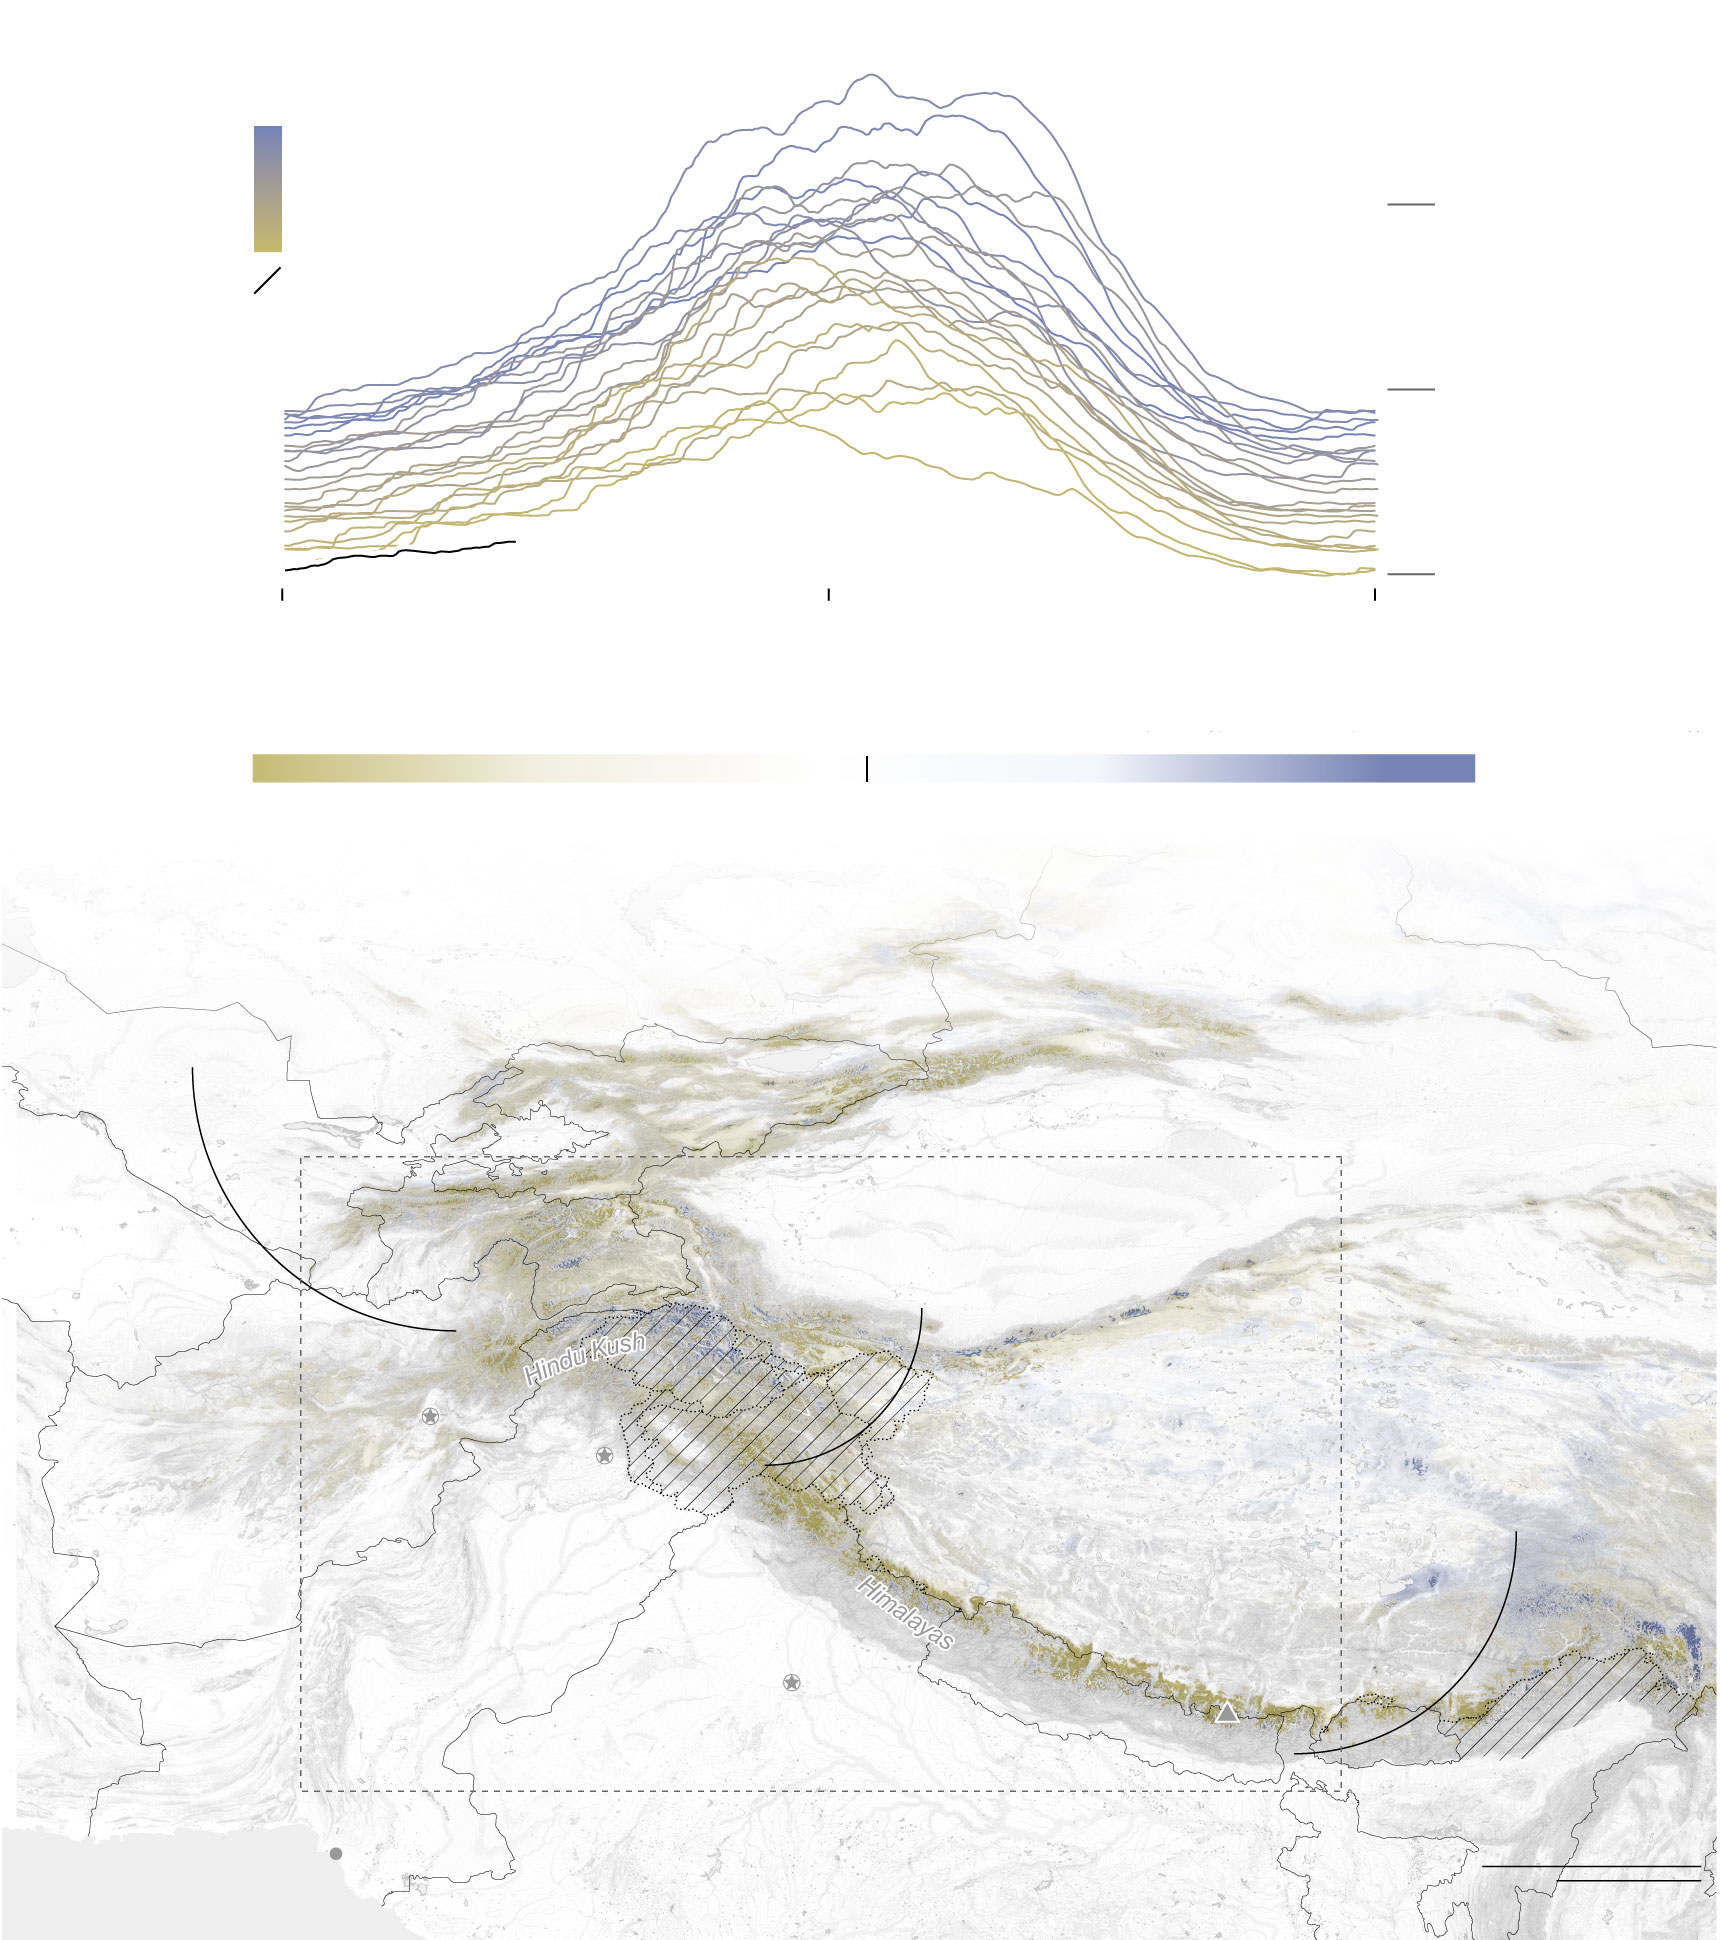
Record Low Snowpack
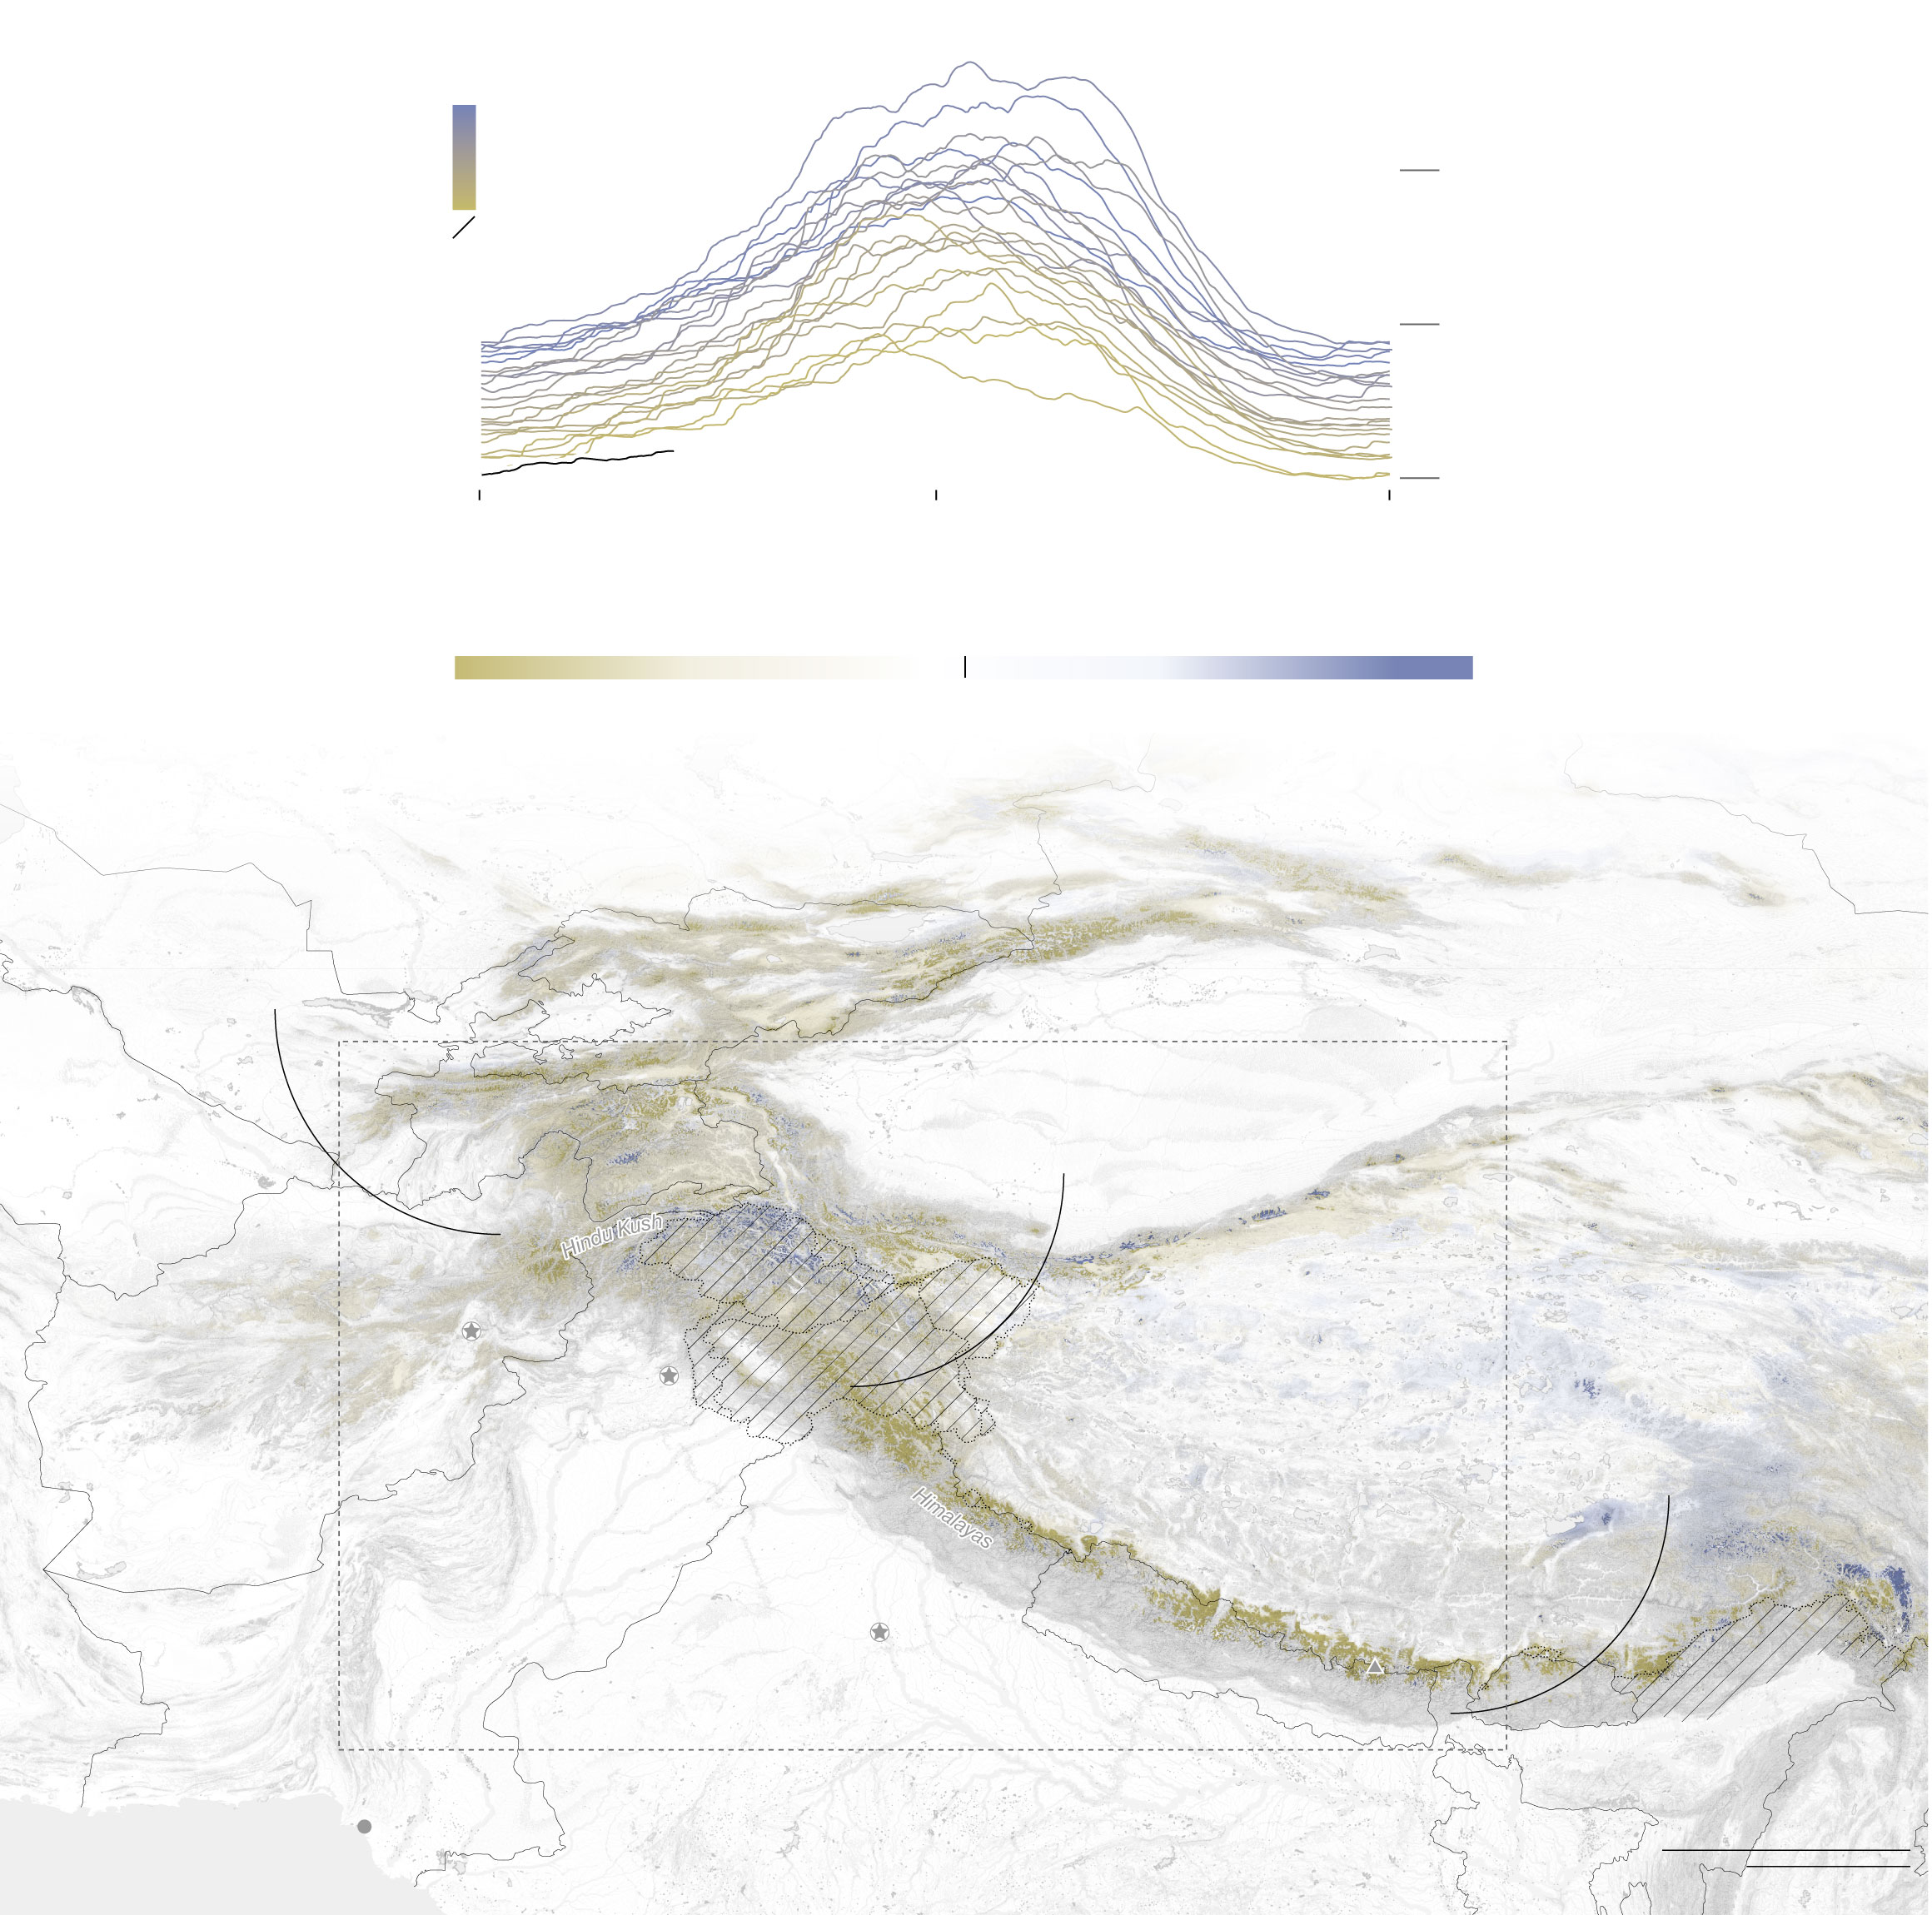
Average snow water equivalent for Central Asia region
Water year
2000
200 mm
2022
2023
150
Dec. 2023
108 mm
100
Oct. 1
April 1
Sept. 30
Dec. 2023 difference from 2001 to 2021 average
-500 mm
0
500 mm
KAZAKHSTAN
Recent multi-year droughts have left approximately 13.1 million people in Afghanistan (29% of the total population) to face extreme food-insecurity to due below-average harvests
Region charted
Kashmir Valley faced the dual threat
of drought-like conditions and flash floods in 2022
CHINA
Kabul
A glacial lake outburst flood and the failure of the Teesta-3 power plant killed at least 30 people in Sikkim in October
AFGHANISTAN
Islamabad
PAKISTAN
Mt. Everest
29,032 ft.
New Delhi
NEPAL
INDIA
Karachi
500 km
Arabian Sea
200 mi
Average snow water equivalent for Central Asia region
Water year
2000
200 mm
2022
2023
150
Dec. 2023
108 mm
100
Oct. 1
April 1
Sept. 30
Dec. 2023 difference from 2001 to 2021 average
-500 mm
0
500 mm
Drought forced 263K people in Afghanistan from their homes in 2018 and left 10.6 million with their food supply at risk.
KAZAKHSTAN
CHINA
Region charted
Kashmir Valley faced the dual threat of drought-like conditions and flash floods in 2022
A glacial lake outburst flood and the failure of the Teesta-3 power plant killed at least 30 people in Sikkim in October
Kabul
AFGHANISTAN
Islamabad
PAKISTAN
Mt. Everest
29,032 ft.
NEPAL
New Delhi
500 km
INDIA
Karachi
Arabian Sea
200 mi
Average snow water equivalent for Central Asia region
Water year
2000
200 mm
2022
2023
150
Dec. 2023
108 mm
100
Oct. 1
April 1
Sept. 30
Dec. 2023 difference from 2001 to 2021 average
-500 mm
0
500 mm
Recent multi-year droughts have left approximately 13.1 million people in Afghanistan (29% of the total population) to face extreme food-insecurity to due below-average harvests
Region charted
Kabul
CHINA
AFGHANISTAN
Islamabad
Mt. Everest
29,032 ft.
PAKISTAN
NEPAL
New Delhi
500 km
Karachi
INDIA
Arabian Sea
200 mi
Average snow water equivalent for Central Asia region
Water year
2000
200
mm
2022
2023
150
Dec. 2023
108 mm
100
Oct. 1
April 1
Sept. 30
Dec. 2023 difference from 2001 to 2021 average
–500 mm
500 mm
0
Region charted
Kabul
CHINA
Islamabad
Mt. Everest
29,032 ft.
PAKISTAN
New Delhi
500 km
Karachi
INDIA
200 mi
Ultimately, if snowpack volume changes enough, “it may become difficult to irrigate agricultural fields in the future, unless adaptation measures are taken,” Gafurov said.
Central Asian countries are eager to modernize water management. Nations will need to come to a regional agreement because snow and water don’t stop at international borders. A US-supported November conference in Samarkand brought together American, Saudi, Pakistani, Jordanian, Iraqi, Kuwaiti, and Kyrgyzstani water experts.
“Cooperation is critical, and it takes time,” Nitu said. “At the end of the day, behaviors need to change — yes, the reality is, things are dire — but to change in a way that makes sense.”
Weather Whiplash
California shares Afghanistan’s mountainous topography and has a nearly identical population size. Though their respective economies are wildly different — renewed Taliban rule has brought humanitarian crises and international isolation — both are highly dependent on snowpack.
California built almost 800 dams and reservoirs between the 1920s and the 1970s to manage a structural problem. Snow and rain fall mainly in the north and most people live in the south. Even with sophisticated infrastructure, the process of delivering water to residents and sectors like agriculture has never been easy, and the state’s winters are becoming only more chaotic.
Each year can alternate between an abundance of snow and a precarious lack of it. California saw a series of snow droughts between 2013 and 2015 amid the worst overall megadrought in at least 1,200 years. The winters in 2017 and 2019 were among the wettest ever. So much rain came down from October 2016 to February 2017 that officials worried the Oroville Dam could give way after its main off-ramp collapsed. As a precaution, they evacuated 180,000 people living below what is the tallest dam in the US. Snow drought returned in 2020-22, and then — whiplash — this past winter broke snowfall records.
Read more: The End of Snow Threatens to Upend 76 Million American Lives
“We always like to say here in California that the average year almost never happens. It’s either a big year or a small year,” said Thomas Painter, founder and CEO of Airborne Snow Observatories, Inc., a NASA spinoff that makes precise snowpack measurements every year.
The impact of snow drought is hardly limited to people. Less snow cover exposes native plants to harsher winter conditions, like windburn, which can affect how well they grow in spring and reduce habitat for wolverines to build their dens at lower elevations, to take just two examples.
Not just California but states across the West are trying to understand the new climate and how shifting snowpack could impact water supplies for people and ecosystems.
Changing amounts of precipitation aren’t the only variable that has water managers searching for answers, but also the timeline of when snow melts.
Historically, runoff into reservoirs peaked in May to June, according to Nolie Templeton, a water resources analyst in the Colorado River Programs Department at the Central Arizona Project. As the planet has gotten warmer, snow is melting between one and four weeks earlier.
The new variability makes the task of managing reservoirs a particularly difficult one. In the 2020-21 water year, a massive November storm “started that year off with a bang,” said Sean de Guzman, manager of the California Department of Water Resources’s Snow Surveys and Water Supply Forecasting section. The subsequent three months — when half the state’s snow usually falls — brought practically nothing else.
“With the extreme wet on one side, earlier in the year, and then basically nothing else coming in, you have that little bit of snowpack to melt,” de Guzman said. “That makes it extremely difficult to be able to forecast how much water supply will eventually refill those reservoirs later on in the season.”
Sophisticated technology gives the western US a unique advantage to measure snow drought and see it coming. Models tailored to specific river basins and extensive on-the-ground weather stations as well as aerial surveys with technology that can pinpoint the height of the snow above the surface all give the region a leg up.
The true test for snowmelt forecasts — a bucket brigade of information from satellites and flights to models, scientists, water agencies, networked states and cities and users — begins with the first trickle of water out of the mountains. And reservoir operators will be waiting for those forecasts even before the last flakes fall each winter.
Jenny Fromm oversees 45 flood control projects across California, Utah and Colorado, for the US Army Corps of Engineers’s Sacramento District. Any moment of any day can turn calm into crisis — a phone call at bedtime — when a colleague sees something amiss in the district’s byzantine water monitoring system.
“It’s not for the faint of heart,” she said.
Understanding snow drought demands collaboration among scientists, engineers, agencies and users beyond anything previously required.
Take wildfires, which increasingly require snow hydrologists and wildfire specialists to work together. As trees go up in smoke, they drop soot that darkens snow and speeds melt. The foliage that burns lets more sunlight reach the forest floor, speeding up melt further still. And areas stricken by snow drought in winter are more likely to suffer wildfires come summer.
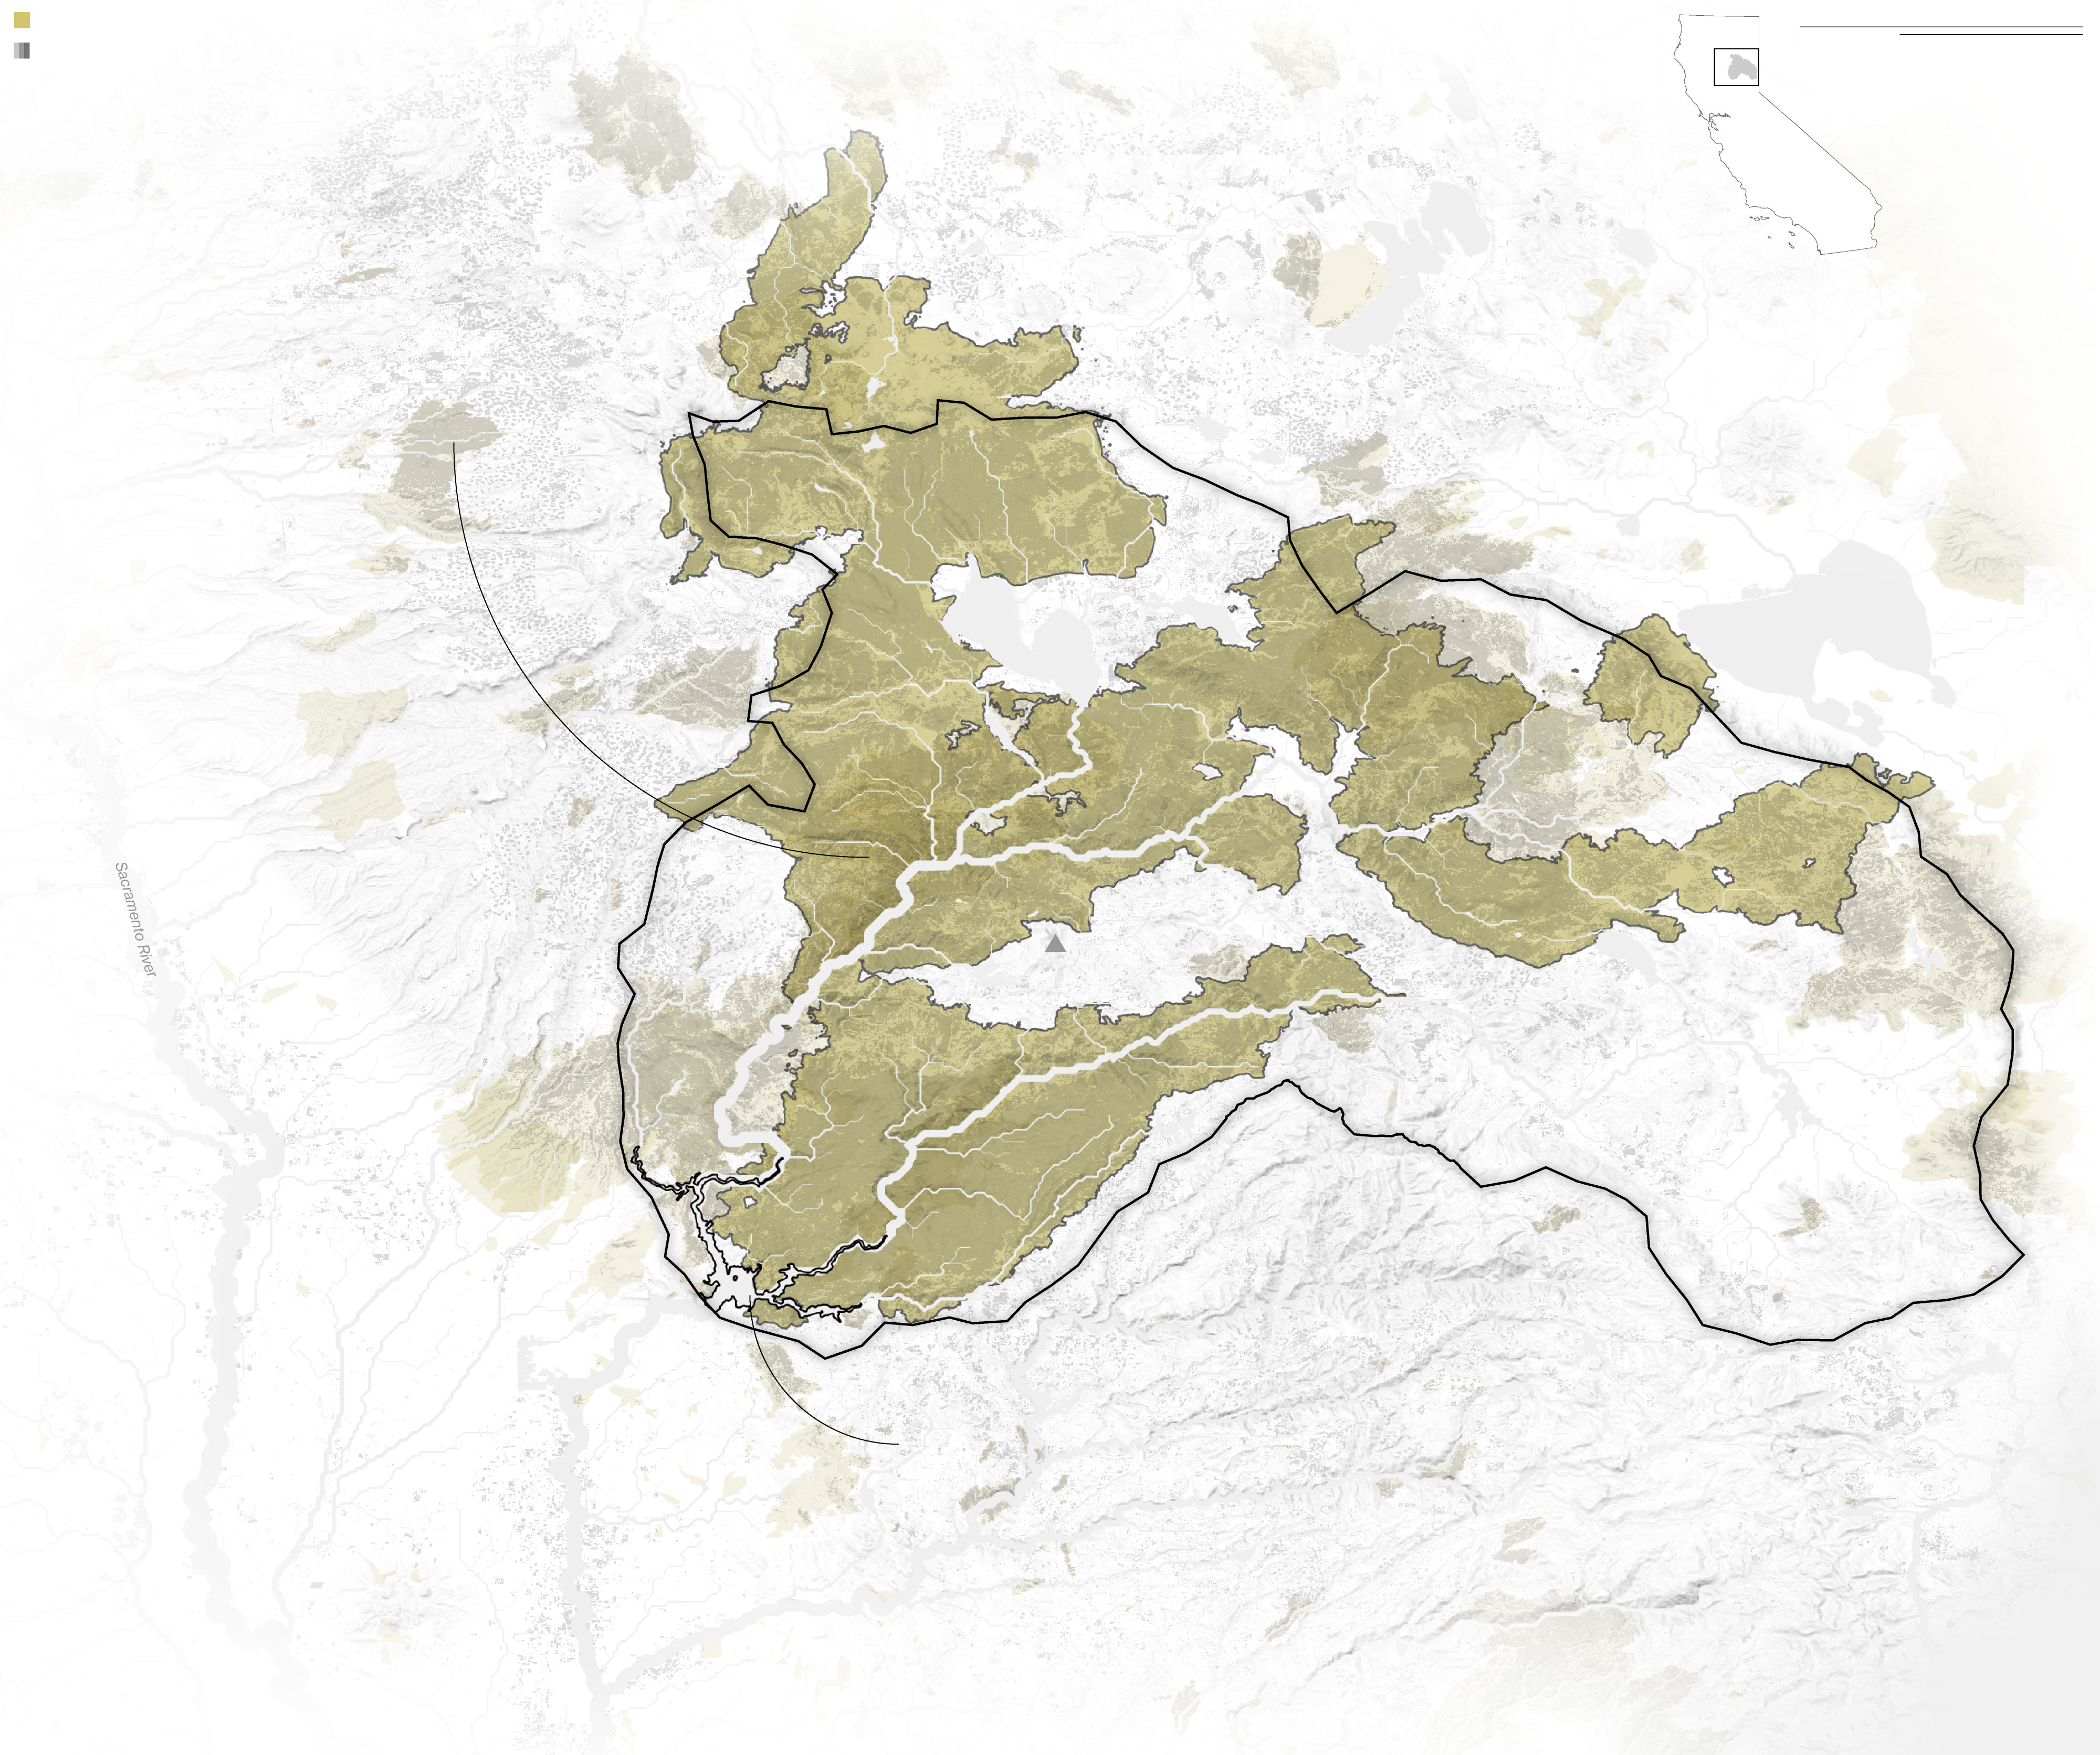
Snow’s Other Big Threat: Wildfires
50 km
Wildfires since 2000
Area of detail
20 mi
Tree loss
CA
Tahoe National Forest
CALIFORNIA
Eagle Lake
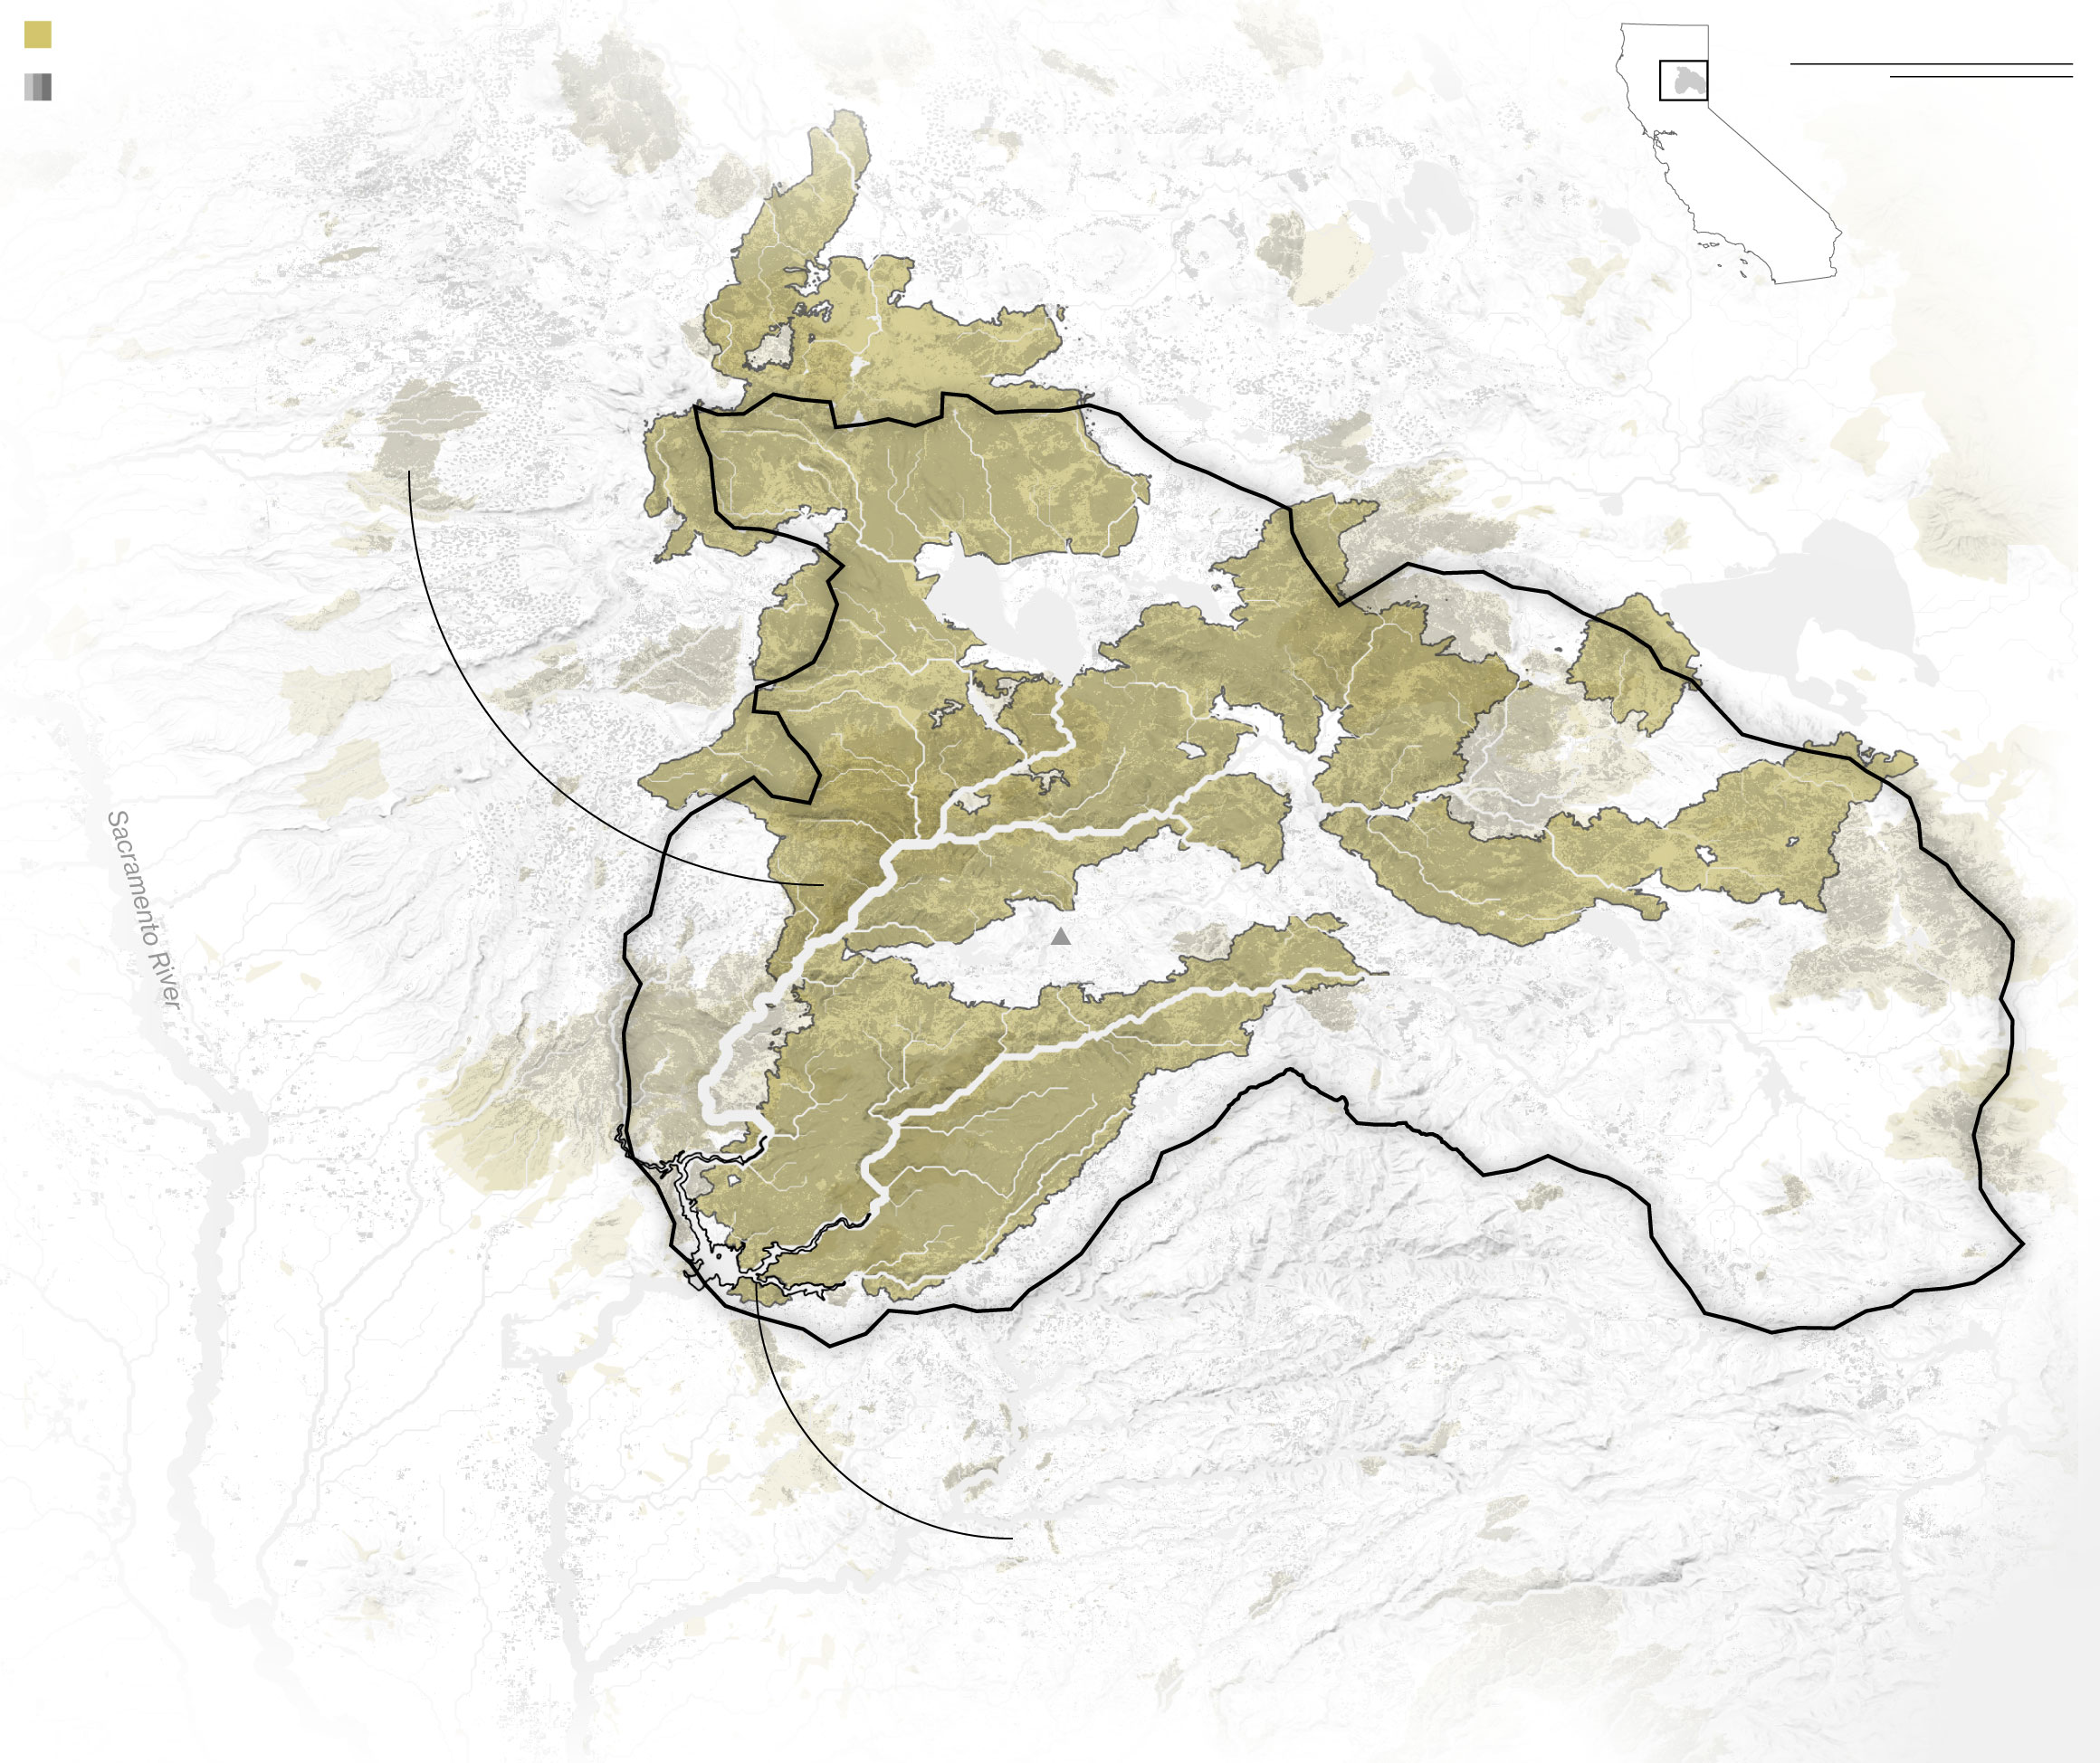
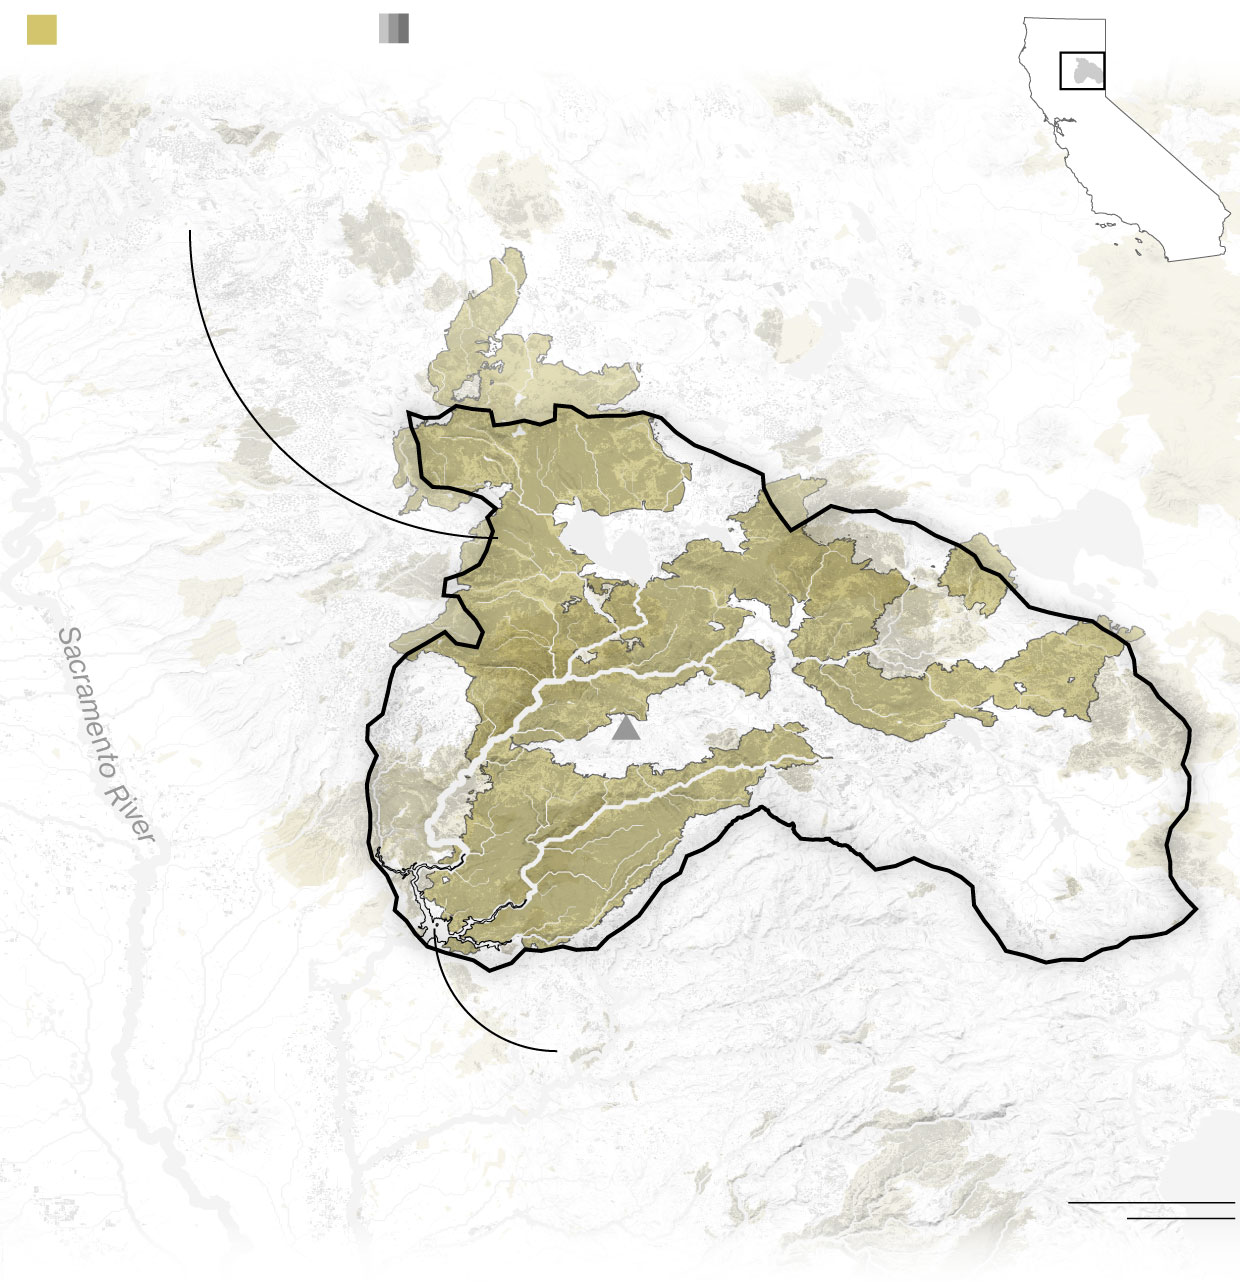
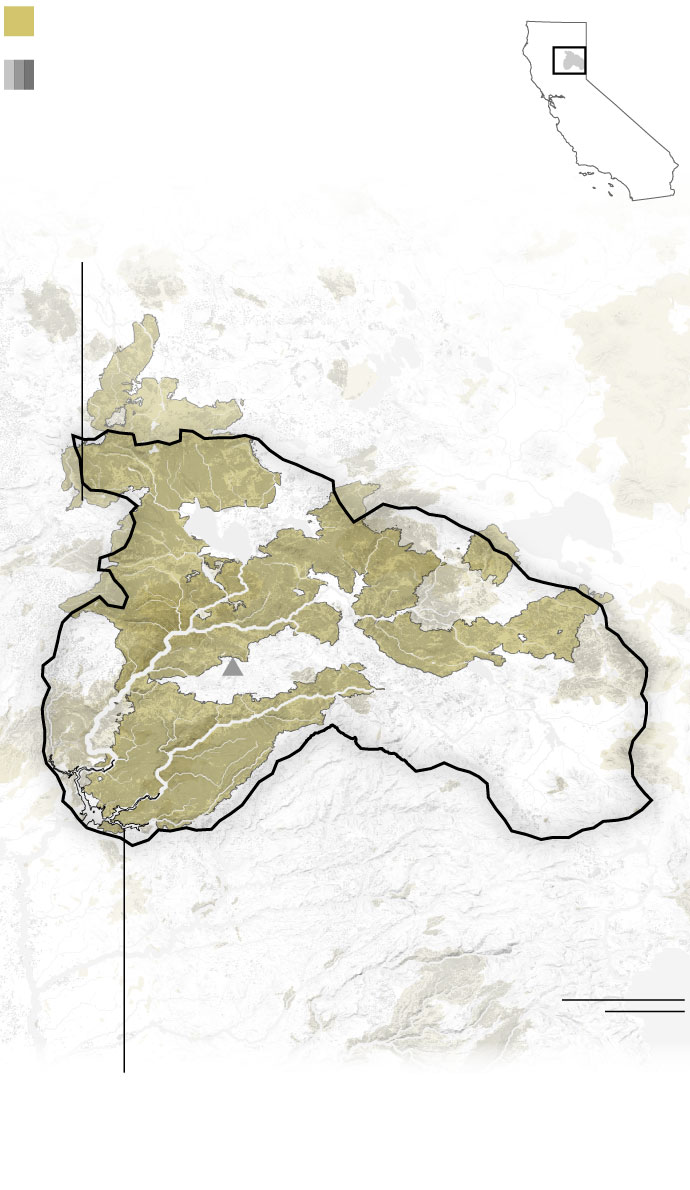
More than 57% of the Upper Feather River Watershed has burned since 2017 due to megafires like North Complex (2020) and Dixie (2021)
Upper Feather River Watershed
Lake Honey
Lake Almanor
Red Bluff
Dixie
North Fork Feather River
Spanish Peak
6975 ft.
Plumas National Forest
Middle Fork Feather River
Chico
North Complex
Lake
Oroville
SAcramento Valley
Oroville
Tahoe National Forest
Lake Oroville, the largest reservoir and source of drinking water for the state, relies on melting snowpack that runs down from the watershed
Feather River
Sutter Buttes
Lake
Tahoe
Yuba City
50 km
Wildfires since 2000
Area of detail
Tree loss
20 mi
CA
CALIFORNIA
Upper Feather River Watershed
More than 57% of the Upper Feather River Watershed has burned since 2017 due to megafires like North Complex (2020) and Dixie (2021)
Dixie
Lake
Almanor
Lake Honey
Spanish Peak
6975 ft.
Plumas National Forest
Chico
North Complex
Lake
Oroville
Oroville
SAcramento Valley
Tahoe National Forest
Feather River
Lake Oroville, the largest reservoir and source of drinking water for the state, relies on melting snowpack that runs down from the watershed
Lake
Tahoe
Yuba City
Area of detail
Tree loss
Wildfires since 2000
More than 57% of the Upper Feather River Watershed has burned since 2017 due to megafires like North Complex (2020) and Dixie (2021)
CA
Upper Feather River Watershed
CALIFORNIA
Dixie
Spanish Peak: 6975 ft.
Chico
North Complex
Oroville
Lake Oroville, the largest reservoir and source of drinking water for the state, relies on melting snowpack that runs down from the watershed
SAcramento Valley
Feather River
50 km
20 mi
Area of detail
Wildfires since 2000
Tree loss
More than 57% of the Upper Feather River Watershed has burned since 2017 due to megafires like North Complex (2020) and Dixie (2021)
CA
Upper Feather River Watershed
CALIFORNIA
Dixie
Spanish Peak: 6975 ft.
North Complex
Oroville
Tahoe National Forest
Feather River
50 km
20 mi
Lake Oroville, the largest reservoir and source of drinking water for the state, relies on melting snowpack that runs down from the watershed
In a warming world, that cooperation will take on added importance. Water resources are expected to become more scarce in many snowpack-dependent areas, putting strain on already overtaxed storage systems. Right-sizing reservoirs to hold water when snow drought hits and not be overwhelmed by it in wet years may be key. Doing this is also expensive, requires years of planning and execution and time is short.
Even though climate change is expected to tip the odds in many regions toward snow drought in the coming decades, water managers will still have to prepare for unwanted surprises from year to year.
“It can be stressful and hard because nature has a mind of her own sometimes,” Fromm said.